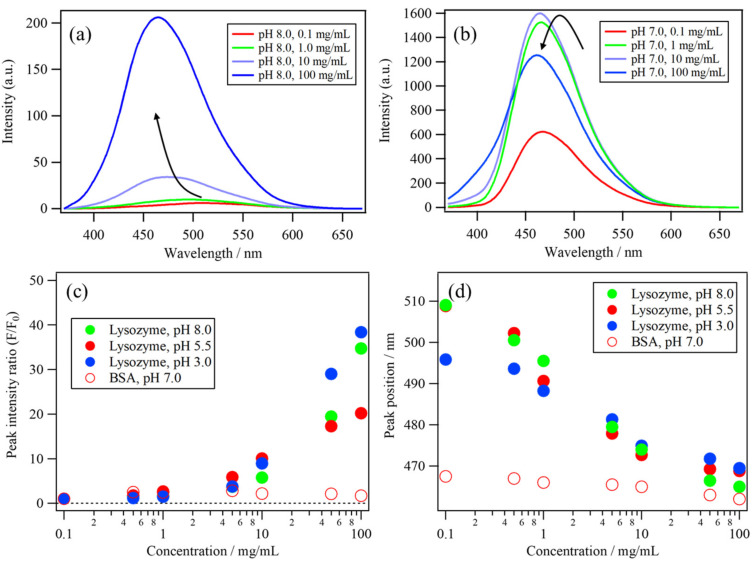
Figure 4.
The protein concentration dependences of the ANS fluorescence of (a) lysozyme solution (pH 8.0) and (b) BSA solution (pH 7.0). The protein concentration dependences of (c) the peak intensity ratio (F/F0) and (d) the peak position of the ANS fluorescence band of lysozyme at pH 8.0, 5.5, and 3.0 and of BSA at pH 7.0.

