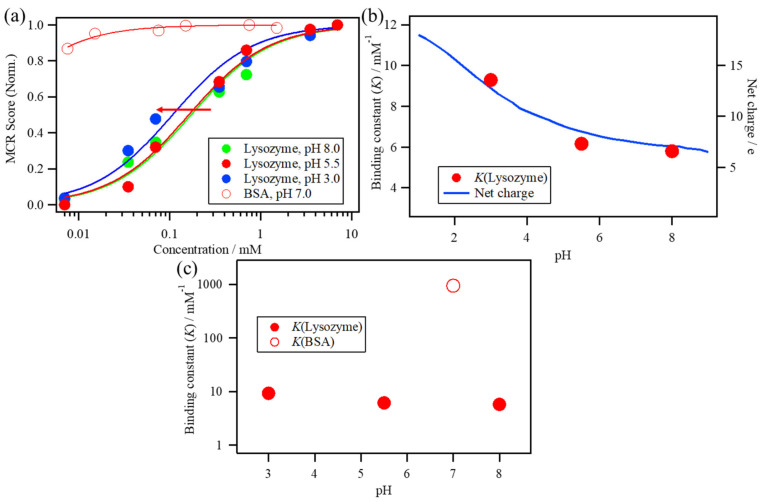
Figure 7.
(a) The increase in MCR Score 2 of the lysozyme solutions at pH 8.0, 5.5, and 3.0 and the BSA solution plotted against the protein concentration. (b) The estimated K value of the lysozyme solutions at pH 8.0, 5.5, and 3.0 with the calculated net charge of lysozyme as a function of pH. (c) The estimated K value of the ANS–BSA binding with one of the lysozyme solutions.

