Figure 3.
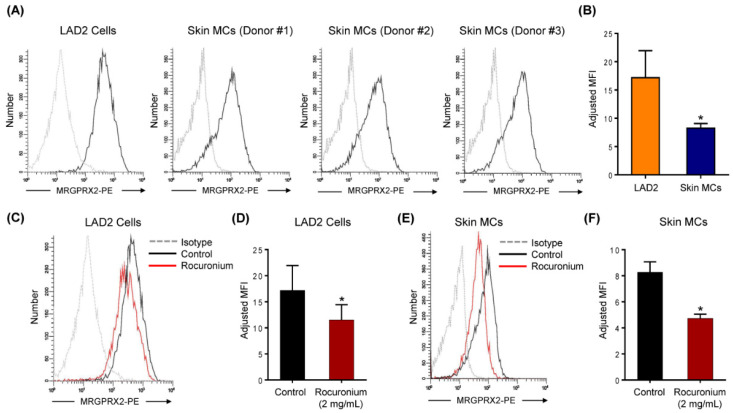
Rocuronium induces MRGPRX2 internalization in LAD2 cells and primary human skin MCs. (A) Flow cytometry histograms for MRGPRX2 cell surface expression (solid black line) and isotype (dotted gray line) are shown. Histograms are representative of three independent experiments. (B) The comparison of MRGPRX2 expression levels between human MC line LAD2 cells and primary human skin MCs. (C) LAD2 cells were stimulated with rocuronium (2 mg/mL) for 30 min, and MRGPRX2 internalization was determined by flow cytometry. (D) The adjusted MFI levels of MRGPRX2 cell surface expression are shown. (E,F) Rocuronium-induced MRGPRX2 internalization and adjusted MFI levels of MRGPRX2 cell surface expression were determined in primary human skin MCs. All data points are the mean ± SEM of at least three experiments. Statistical significance was determined by two-tailed unpaired t-test. * p < 0.05.

