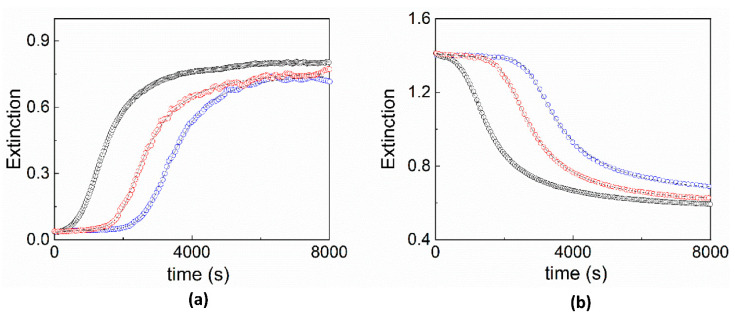
Figure 1.
Extinction kinetic profiles recorded at 492 nm (a) and 434 nm (b) for the aggregation of H2TPPS44− induced by adopting three different reagent mixing order protocols (black traces—mix 1; red traces—mix 2; blue traces—mix 3). Experimental conditions: [H2TPPS44−] = 3 μM; [HCl] = 0.3 M; [NaCl] = 0.2 M, T = 298 K. The solid lines show the best fit of the experimental data to Equation (1).

