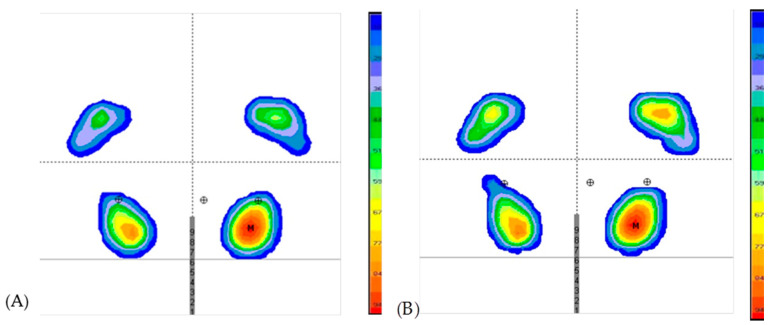
Figure 2.
Static pressure distributions of the footprint in a representative subject (A) before dry needling. (B) after dry needling. Heel part of footprint A and B is located in the lower part. Gray lines and the middle gray numbers indicate the same position in both measures before and after they are invariably applied by the platform. M is the point of highest maximum pressure of the entire static footprint. Rounds with a cross mean are the center of pressures reflected within the tread. The central round is that of both feet, and the lateral ones calculated for each foot. The scale to the right of each footprint is the color representation of the pressure in gram/centimieters2 (g/cm2), 0 to 29 g/cm2 is blue, 29 to 36 g/cm2 is purple, 36 to 59 g/cm2 is green, 59 at 77 g/cm2 is yellow, from 77 to 89 g/cm2 is orange, from 89 to 100 g/cm2 is red.

