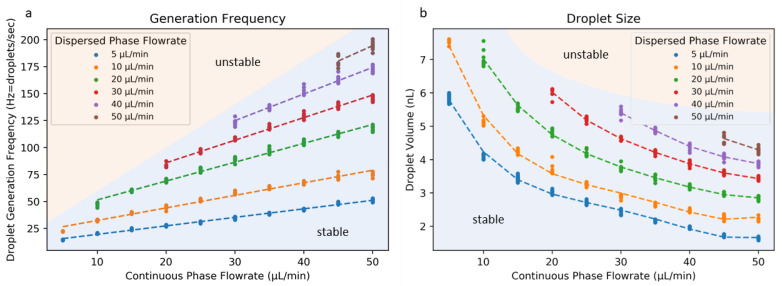
Figure 8.
Generation frequency (a) and droplet size (b) associated with the ACC geometry for various flow rates for the dispersed and continuous phases. Flow rates for the continuous phase (vegetable oil) too far below those for the dispersed phase (water) resulted in unstable flow. Individual data points represent single experiments.

