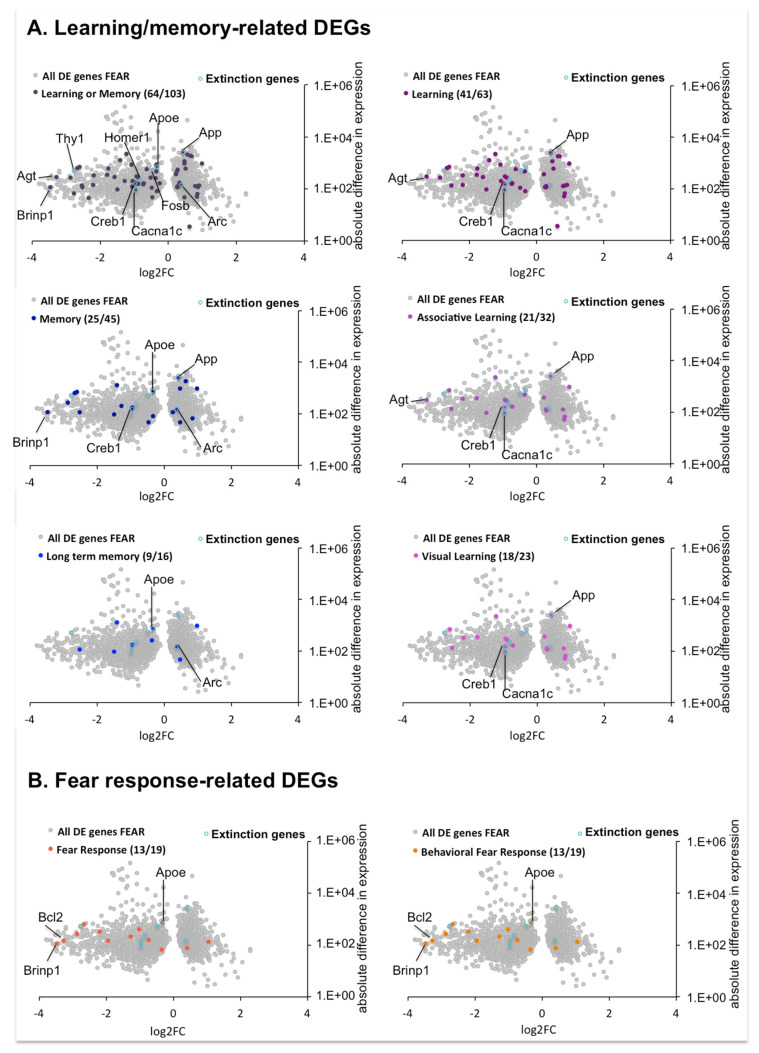
Figure 7.
Differentially Expressed Genes (DEGs) with Gene Ontology annotations associated to Learning/memory and Fear response, between OPTO FEAR vs. SHAM FEAR groups. DEGs for each indicated Biological Process (BP) are highlighted as colored dots on the volcano plot representing the total DEGs between OPTO FEAR vs. SHAM FEAR groups, indicated by grey dots. Numbers into brackets indicate the number of DEGs related to each indicated BP over the gene universe. Light blue dots indicate genes described in literature as associated to fear extinction. When DEGs are part of the top twenty DEGs list and/or part of the considered BP the gene name is indicated.

