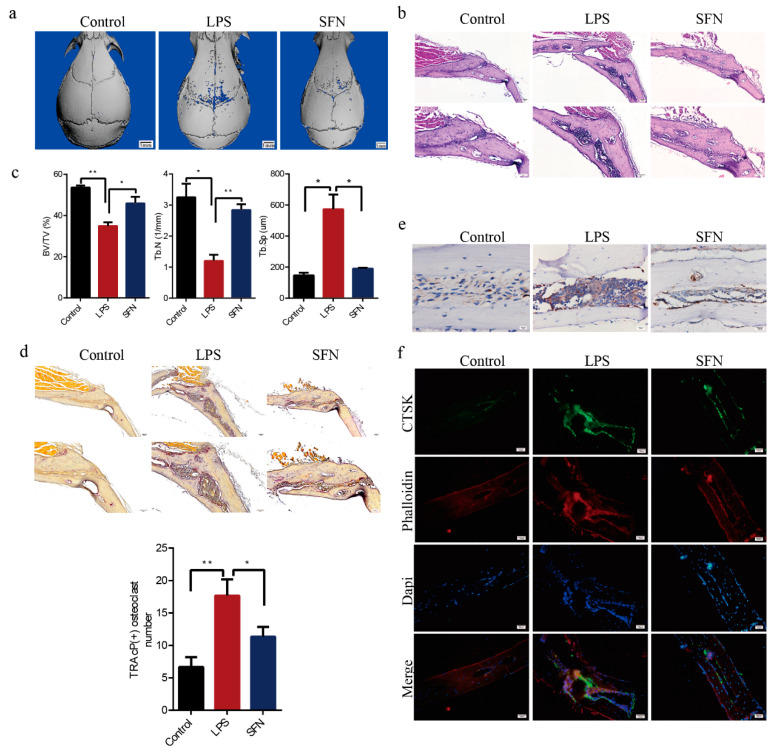
Figure 5.
SFN protected against lipopolysaccharide (LPS)-induced calvarial bone destruction in mice. (a) Micro computed-tomography (CT) 3D reconstructed images. Calvarias were fixed, decalcified, dehydrated, embedded, and sectioned. (b) Representative hematoxylin-and-eosin (HE) staining images. (c) Microarchitectural parameter analysis: trabecular bone volume/total volume (BV/TV), trabecular number (Tb.N), and trabecular separation (Tb.Sp). (d) Representative tartrate-resistant acid phosphatase (TRAP) staining images showing osteoclastogenesis in each sample and corresponding statistics. (e) Representative IHC images locating CTSK. (f) Representative IF images of the distribution of CTSK (green). Phalloidin (red) indicates cytoskeleton and bone. DAPI (blue) was used to counterstain the nuclei. Values are mean ± SEM of three independent experiments; * p < 0.05, ** p < 0.01.

