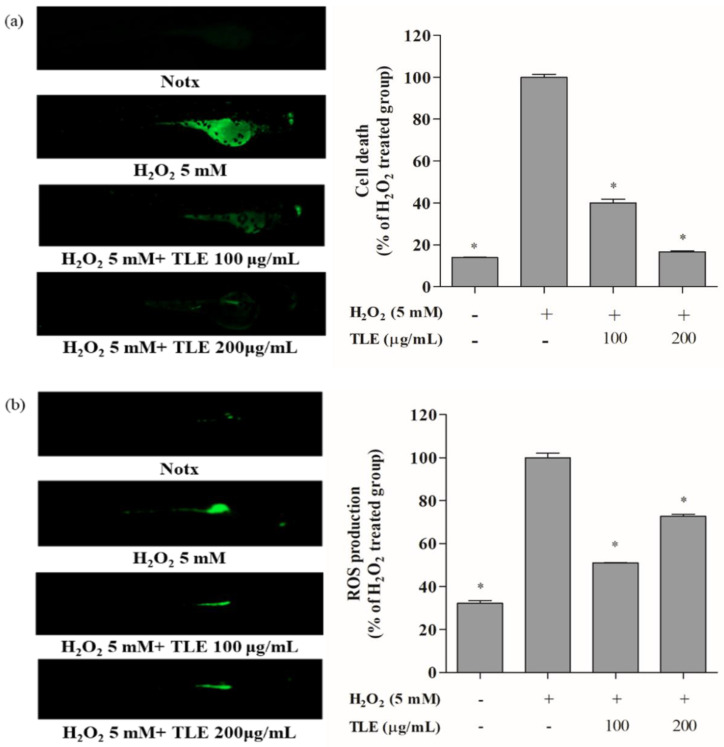
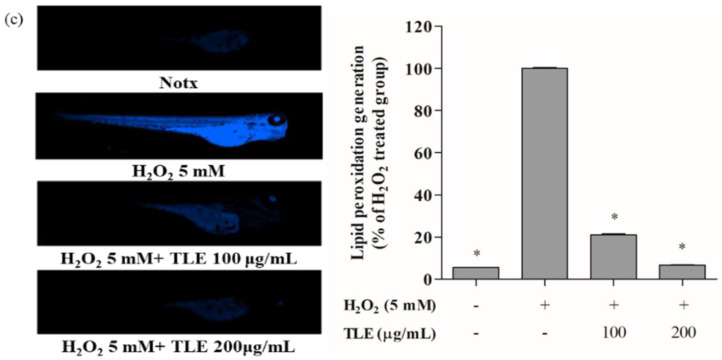
Figure 6.
Cell death, ROS production, and lipid peroxidation in zebrafish. Zebrafish embryos were pre-treated with TLE (50, 100, and 200 μg/mL) and/or treated with H2O2 (5 mM). Imaging of (a) cell death, (b) ROS production, and (c) lipid peroxidation was performed using fluorescence microscopy. The fluorescence intensity of zebrafish was quantified using ImageJ software. The data were measured in triplicate and expressed as the mean ± SE. * p < 0.05 compared with the H2O2-treated group.


