
Figure 5.
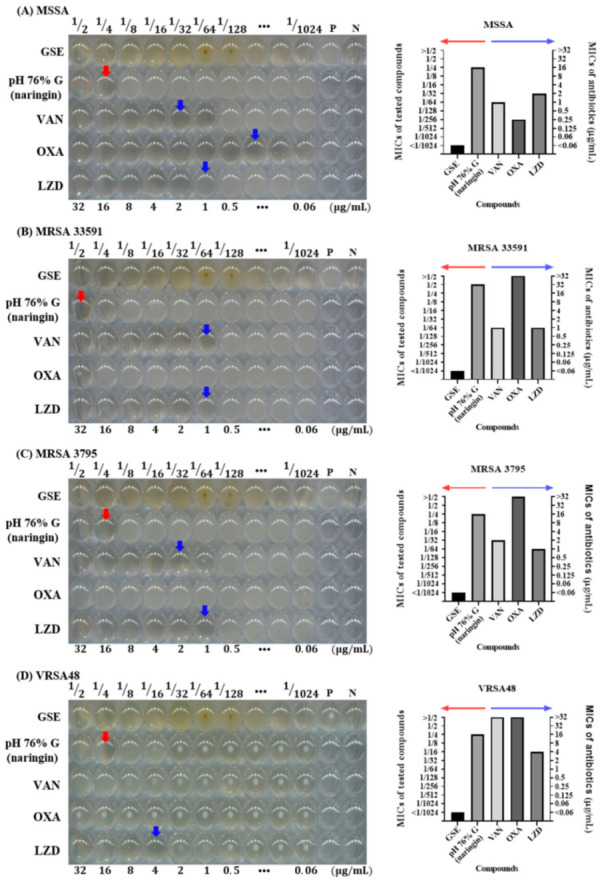
Microdilution MIC test with naringin against MSSA, MRSA, and VRSA. (A) S. aureus ATCC 6538 (MSSA), (B) S. aureus ATCC 33591 (MRSA), (C) S. aureus CCARM 3795 (MRSA), and (D) VRSA48. P is a positive control without any antimicrobial agents, and N is a negative control with only media and DW. In the 96-well plate, from left to right, the GSE and pH 76% G (naringin) concentrations were 1/2 to 1/1024, and the concentrations of antibiotics were 32 to 0.06 µg/mL. The MICs of pH 76% G (naringin) are indicated by red arrows, and antibiotic MICs are indicated by blue arrows. MIC values <1/1024 or >32 µg/mL are not indicated by arrows. The MIC values for GSE, pH 76% G (naringin), and antibiotics for each of the bacterial strains are also illustrated by bar graphs next to the 96-well plate figures. In the bar graphs, the MIC values of GSE and pH 76% G (naringin) can be read along the left y-axis indicated by the red arrow, and the MIC values of antibiotics can be read along the right y-axis indicated by the blue arrow. GSE and the antibiotics showed the same effect, as shown in Figure 4. The pH 76% G (naringin) did not show a better effect than the pH 76% G. This indicates that substances other than naringin in GSE affect the antibacterial activity of GSE.