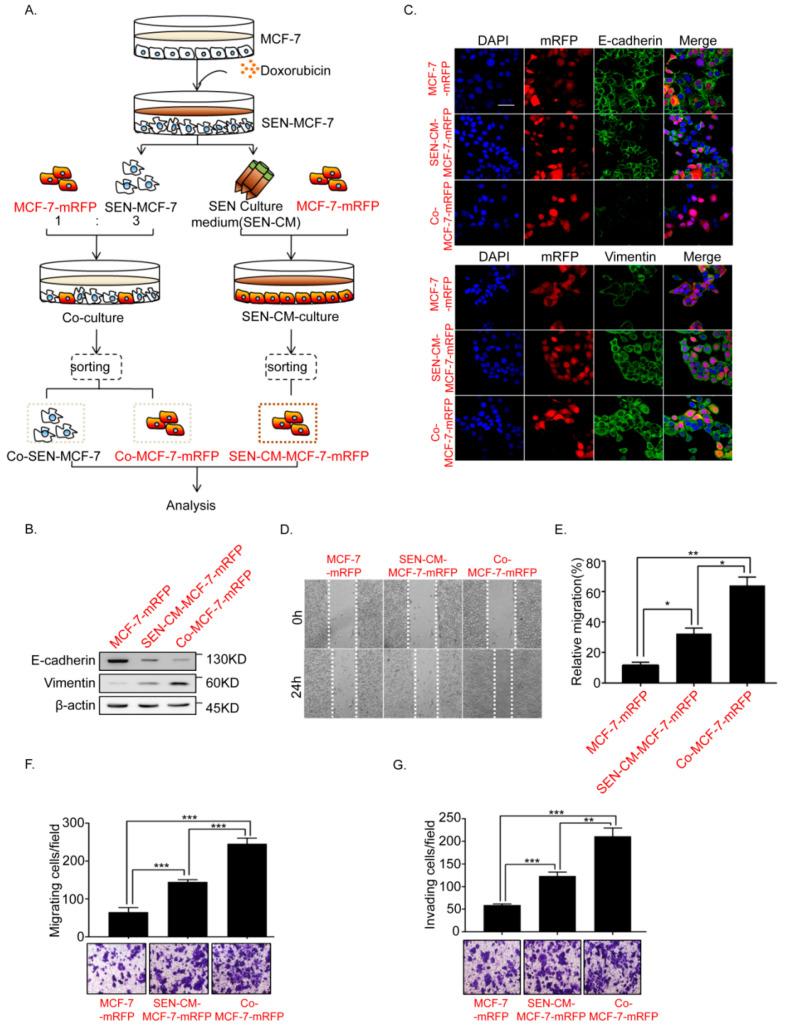
Figure 1.
Doxorubicin (Dox)-induced MCF-7 cell senescence promoted the epithelial–mesenchymal transition (EMT) of adjacent breast cancer cells. (A) Schematic diagram showing the experimental setup. Schematic diagram of the co-culture systems. Senescent MCF-7 cells (SEN-MCF-7) induced by Dox (200nM) were co-cultured with MCF-7-mRFP at a 3:1 ratio (SEN-MCF-7:MCF7-mRFP). Senescent MCF-7 cells (SEN-MCF-7) were recovered from the supernatant and mixed with normal medium at a 3:1 ratio (senescence supernatant: normal medium) as conditional medium (SEN-CM) for MCF7-mRFP cell monocultures. Red and black letters, used to distinguish two types of MCF-7 cells. Red letters: MCF-7 cells fused to red fluorescent protein, mRFP. Black letters: MCF-7 cells without fusing to mRFP. (B) Immunoblot analysis of protein expression of the epithelial marker E-cadherin and mesenchymal marker Vimentin in MCF-7-mRFP cells with the indicated treatments. (C) Immunofluorescence staining for EMT markers in MCF-7-mRFP cells with the indicated treatments. Scale bar, 50μm. (D,E) Wound-healing assay of MCF-7-mRFP cells with the indicated treatments. (D) Representative micrographs of wound-healing assay are shown. (E) Data represent the relative migration ratio of cells per field (error bars indicate mean SD, n = 3 experimental replicates, * p < 0.05, ** p < 0.01, *** p < 0.001). (F) Migration assay of MCF-7-mRFP cells with the indicated treatments. Representative micrographs of the migrated cells are shown. Data represent the number of cells derived from mean cell counts of five fields (Error bars indicate mean SD, n = 3 experimental replicates, * p < 0.05, ** p < 0.01, *** p < 0.001). (G) Invasion assay of MCF-7-mRFP cells with the indicated treatments. Representative micrographs of the migrated cells are shown. Data represent the number of cells derived from mean cell counts of five fields (Error bars indicate mean SD, n = 3 experimental replicates, * p < 0.05, ** p < 0.01, *** p < 0.001).

