Figure 2.
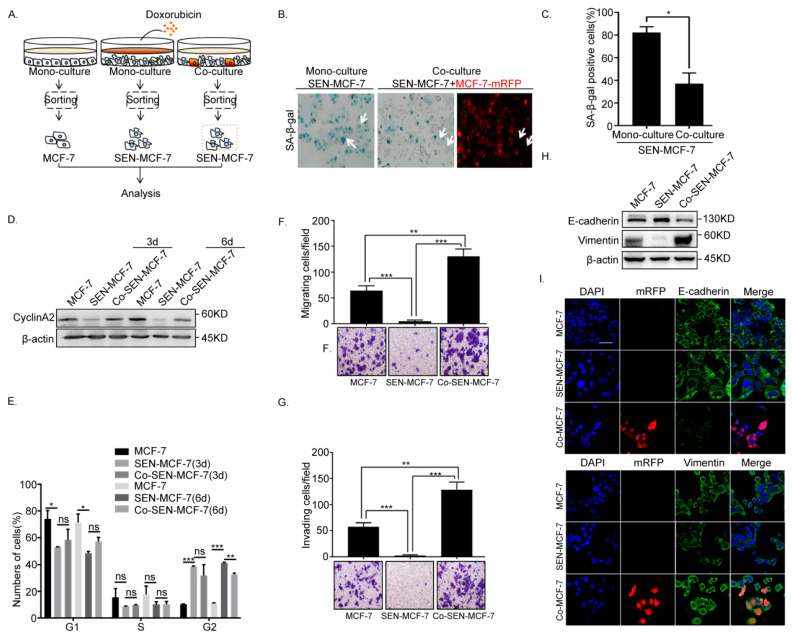
Senescent MCF-7 cells re-entered the cell cycle and underwent EMT in the co-culture. (A) Left: Scheme showing the experimental setup. Flow cytometry sorting of collected senescence breast cancer cells (Co-SEN-MCF-7) co-cultured with MCF-7-mRFP for 3 or 6 days. (B,C) β-Gal staining analysis of MCF-7 cells subjected to the indicated treatments and fluorescence microscopy of MCF-7-mRFP cells. Arrow, senescent MCF-7 cells (SEN-MCF-7 and Co-SEN-MCF-7). (B) Representative images. (C) Percentage of β-gal positive cells (error bars indicate the mean SD, n = 3 experimental replicates, * p < 0.05). (D) Right: Immunoblot analysis of protein expression of cyclinA2 in MCF-7 cells with the indicated treatments. (E) Cell cycle analysis of MCF-7 cells with the indicated treatments. Percentages of cell subpopulations at different cell cycle phases based on triplicate experiments (Error bars indicate mean SD, n = 3 experimental replicates, * p < 0.05, ** p < 0.01, *** p < 0.001). (F) Migration assays of MCF-7 cells with the indicated treatments. Representative micrographs of migrated cells are shown. Data represent the number of cells derived from mean cell counts of five fields (error bars indicate mean SD, n = 3 experimental replicates, ** p < 0.01, *** p < 0.001). (G) Invasion assay of MCF-7 cells with the indicated treatments. Representative micrographs of migrated cells are shown. Data represent the number of cells derived from mean cell counts of five fields (Error bars indicate mean SD, n = 3 experimental replicates, ** p < 0.01, *** p < 0.001). (H) Immunoblot analysis of protein expression of the epithelial marker, E-cadherin, and mesenchymal marker, Vimentin, in MCF-7 cells subjected to the indicated treatments. (I) Immunofluorescence staining of EMT markers in MCF-7 cells subjected to the indicated treatments. Scale bar, 50 μm.

