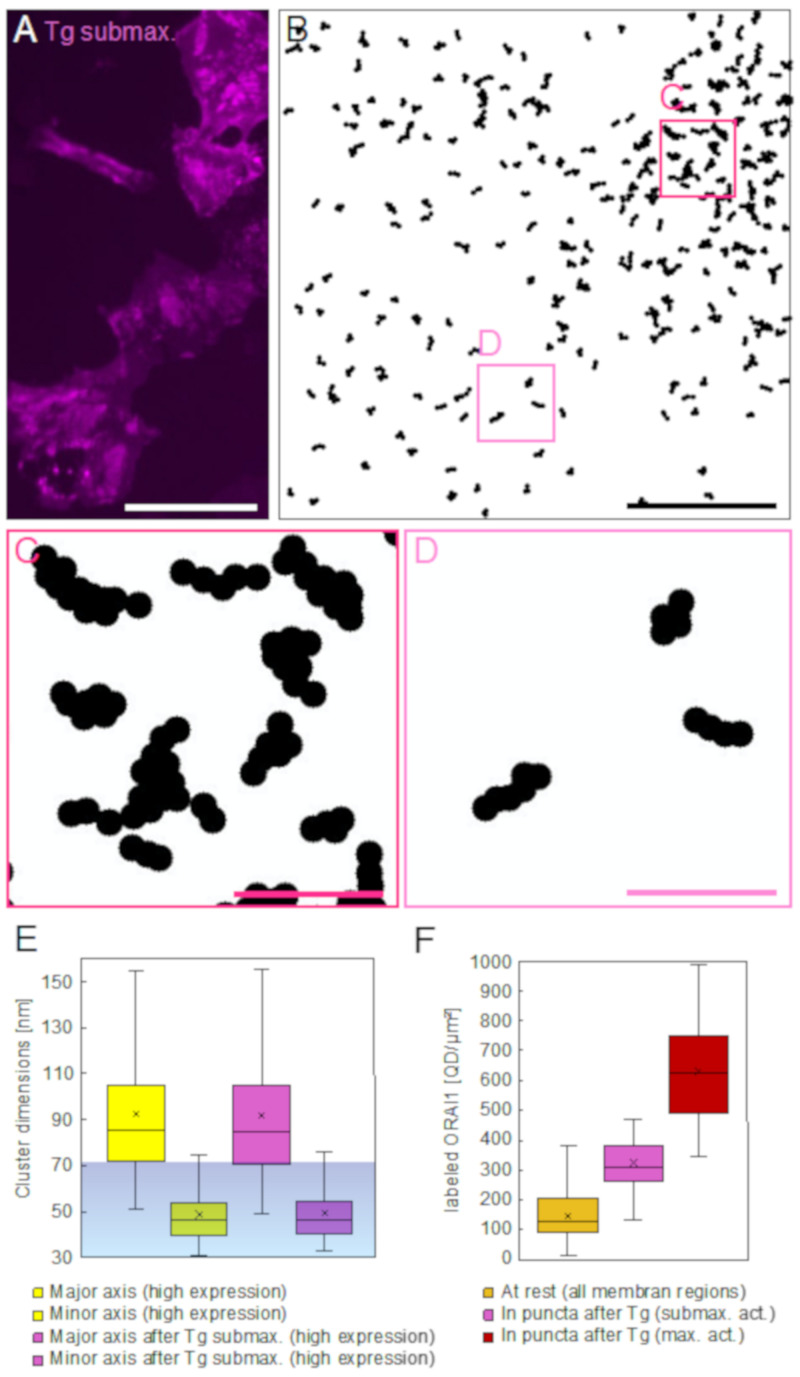
Figure 4.
ORAI1 distributions 15 min after Tg in sub-maximally SOCE-activated cells (expressing ORAI1 and STIM1 in a 1:1 ratio). (A) Fluorescence microscopy image of the QD signal showing accumulations of ORAI1 in bright patches. Most of these regions with dense ORAI1 distributions are larger and blurrier than the puncta found after maximal SOCE-activation (compare to Figure 3A). (B) Cluster analysis of an exemplary STEM image recorded after sub-maximal SOCE-activation showing all clusters >2. The clusters are scattered throughout the image area except for the area in the right upper part of the image where clusters have accumulated. Most clusters have elongated shapes similar to those found in resting and in maximally SOCE-activated cells (compare to Figure 2E,F and Figure 3D). (C,D) show magnified details of the boxed regions in (B), revealing that several clusters in the condensed puncta area have aligned during the redistribution process elicited by the SOCE-activation. Clusters found outside the condensed area (D) remained mostly separated. (E) Spatial dimensions of label clusters >2 detected in STEM images from high ORAI expressing cells at rest (yellow, 1548 clusters), and after sub-maximal SOCE-activation (pink, 1344 clusters). In both groups, 75% of the clusters have major axis lengths exceeding the spatial limit for labels bound to the same ORAI1 hexamer, whereas the length of the minor axis almost always remains below this limit. The dimensions of clusters from cells at rest and after activation are not significantly different. (F) Comparison of QD-labeled ORAI1 densities in STEM images recorded from all plasma membrane regions of resting cells (dark yellow, 113 STEM images), with densities in puncta from sub-maximally SOCE-activated cells (pink, 36 puncta), and puncta from maximally SOCE-activated cells (red, 10 puncta). In cells with similar average label densities, sub-maximal SOCE-activation had doubled the regional density of labeled ORAI1 in puncta, whereas maximal activation resulted in a four-fold increase in density. Scale bars in (A,B) = 50 μm, in (C,D) = 200 nm.

