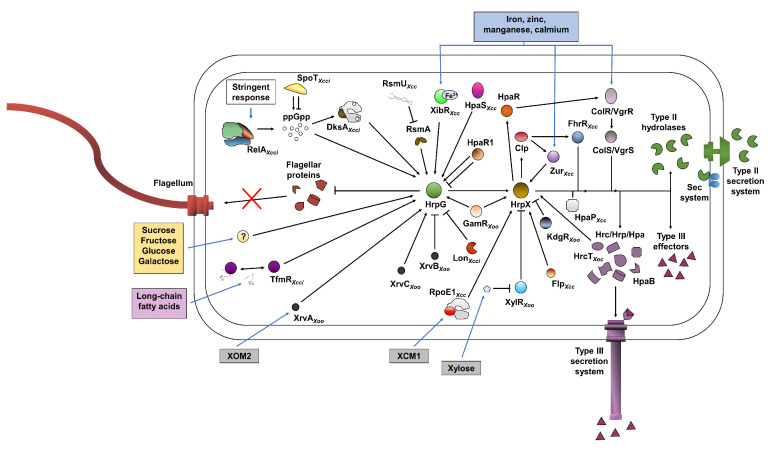
Figure 2.
Schematic representation of the metabolic and genetic regulation of hrpG and hrpX in Xanthomonas. Metabolites and environmental cues are represented in rectangles. Arrows and “⊣” signs indicate that a protein promotes or inhibits the target, respectively, based on transcriptional or functional analyses. If the analysis was based on data derived from specific Xanthomonas species, it is marked at the bottom of the represented protein names. Data represent information derived from X. euvesicatoria, X. citri subsp. citri (Xcci), X. oryzae pv. oryzae (Xoo), X. oryzae pv. oryzicola (Xoc), X. axonopodis pv. glycines and X. campestris pv. campestris (Xcc).

