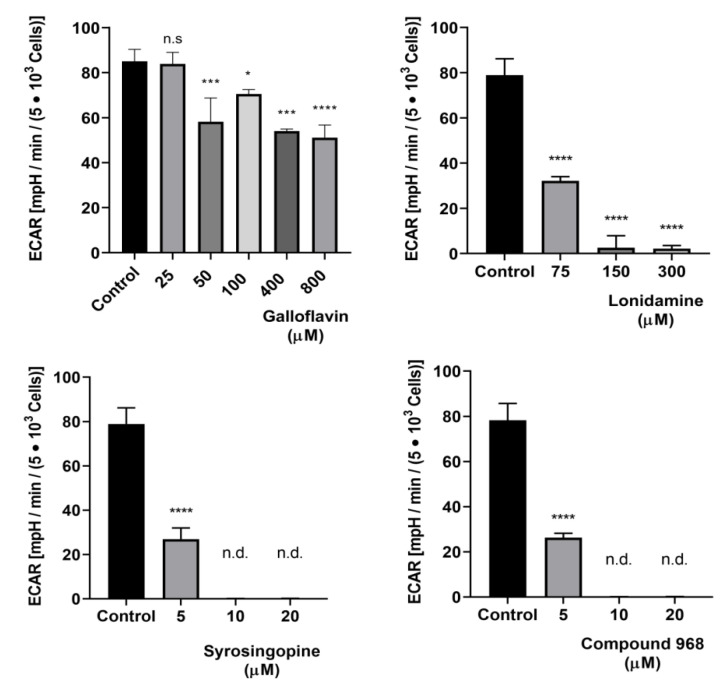
Figure 7.
Effects of galloflavin, lonidamine, syrosingopine and compound 968 treatments on glycolysis in uninfected HCT-8 cells cultivated at hyperoxic (21% O2) condition. Glycolysis stress test revealed a significant reduction of glycolytic responses by selected inhibitors. Bars represents mean ± SD, (n = 3). Data were evaluated for significance by one-way analyses of variance (ANOVA) followed by Dunnett’s test. n.s = non-significant, n.d. = non-detectable, * = p ≤ 0.05, *** = p ≤ 0.001, **** = p ≤ 0.0001.

