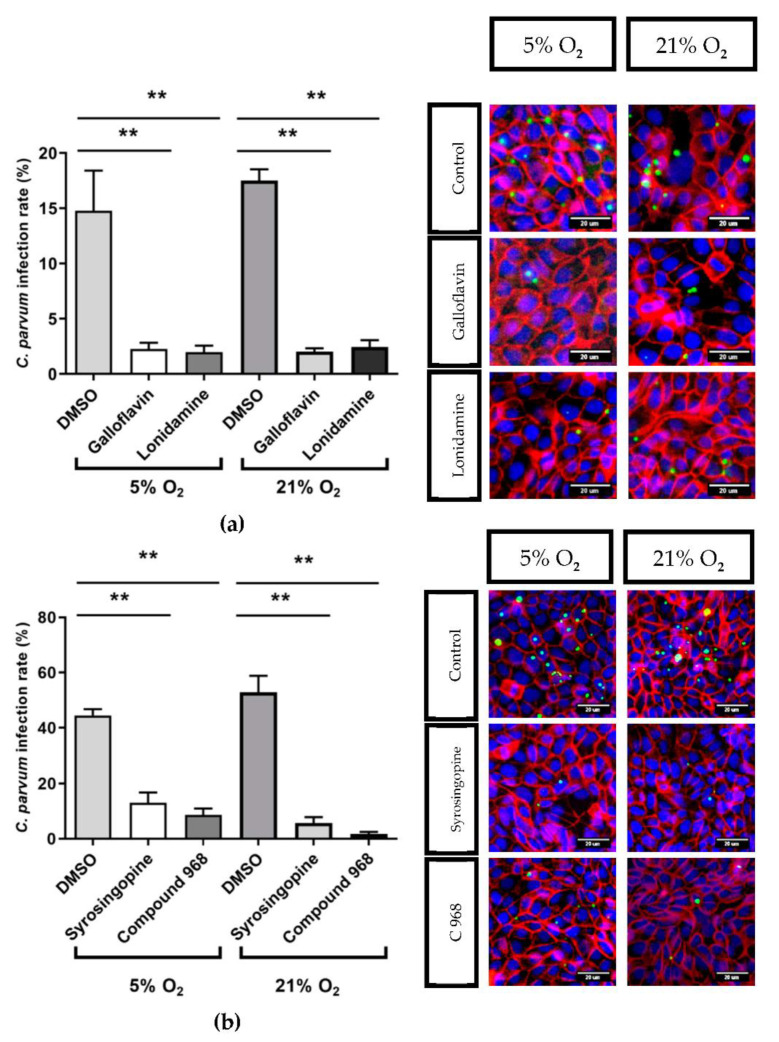
Figure 8.
Effects of galloflavin (400 µM), lonidamine (150 µM) (a), syrosingopine (10 µM) and compound 968 (10 µM) (a,b) treatments on C. parvum infection rates in HCT-8 cells cultivated at 21% O2 and 5% O2, and exemplary illustrations of respective inhibition assays. C. parvum was stained with VVL, green; host -cell membranes and nuclei were labelled with anti-ß-catenin (red) and Hoechst (blue), respectively. Bars show means ± SD, (n = 6). For evaluation of significance t-test was performed. ** = p ≤ 0.01.

