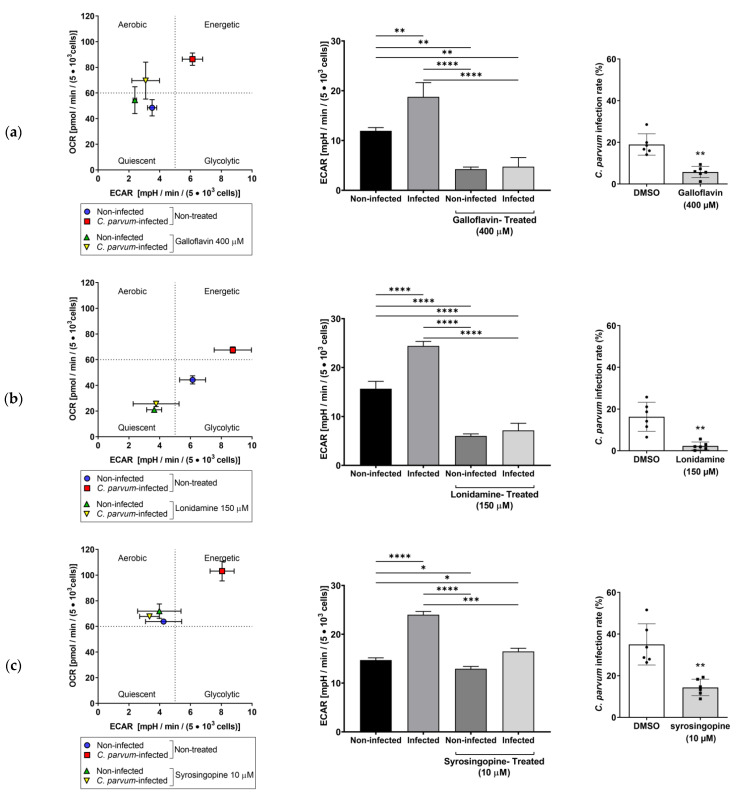
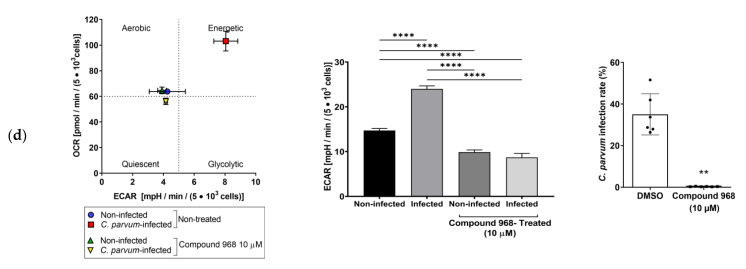
Figure 9.
Impact of C. parvum infection and inhibitor treatments on HCT-8 energetic profiles: (First column) The current energetic profiles are plotted by presenting OCR- and ECAR values in HCT-8 (n = 3, each condition). (Second column) Effect of galloflavin (a), lonidamine (b), syrosingopine (c) and compound 968 (d) treatments on energetic profiles of HCT-8 infected and non-infected controls: The glycolytic function was evaluated in C. parvum-infected host cells under 21% O2 by means of Seahorse Glycolysis Stress Test. Glycolytic activities in treated and infected cells were compared with untreated and infected cells, revealing a significant reduction in glycolytic capacity. (Third column) Thus, reduced glycolytic capacity corresponds with significant reduction of infection rates. Bars present means ± SD, (Energy maps, First column, n = 3; Glycolysis, second column n = 3, Infection rates, third column, n = 6). For evaluation of significance on glycolytic function (second column) one-way analyses of variance (ANOVA) followed by Dunnett’s test was performed. Significances of inhibitors effects on infection rates (third column) were estimated by means of t-test. * = p ≤ 0.05, ** = p ≤ 0.01, *** = p ≤ 0.001, **** = p ≤ 0.0001.


