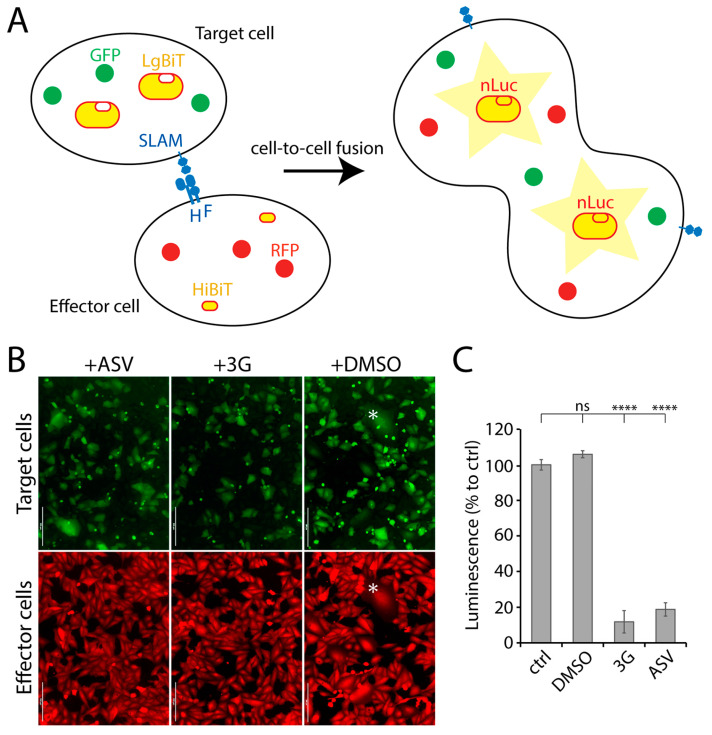
Figure 1.
NanoLuc luciferase (nLuc)-based cell-to-cell fusion assay. (A) Schematic illustration of the cell-to-cell fusion assay. (B) Fluorescence micrographs of target (green) and effector (red) cells. Effector and target cells were mixed either in presence or absence of either 3G or Asunaprevir (ASV). The asterisk highlights syncytia expressing both the red and green fluorescent proteins. (C) Measurement of membrane fusion between effector and the target cells either in presence or absence of either ASV or 3G by recording luminescence emission. Each column represents replicate values from 3 independent experiments. Asterisks indicate statistical significance between the control and each group, as determined using one way ANOVA with Dunnett’s test (**** p < 0.0001). ns: not significant. Scale bars: 200 μm.

