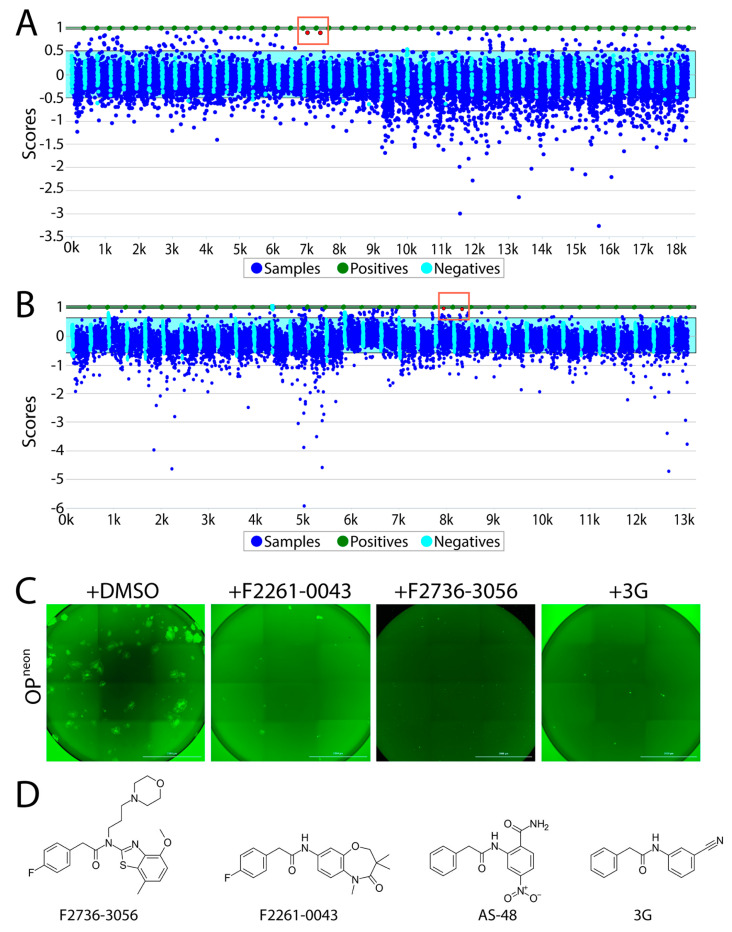
Figure 2.
High-throughput screening of small molecules from the two independent libraries. (A) Laboratory Information Management System (LIMS) plot showing the result of small molecule screening from the CDC library. The positive control is normalized to have a score of 1 (equivalent to 100% inhibition) and the negative control is normalized to have a score of 0 (equivalent of 0% inhibition + 100% activity). While the Y axis displays the value of each data point relative to the controls, the X axis illustrates the samples screened (in duplicates). Green dots indicate the positive control (i.e., 3G); sky blue cyan dots represent the negative control (DMSO); dark blue dots show the compounds screened. Red dots in the red box indicate the selected top hit (in duplicates). While the light blue window represents the 3 standard deviations of the negative controls, the green window is the equivalent for the positive control. (B) LIMS plot showing the result of screening from the protein–protein interaction (PPI) library. Red dots in the red box indicate the selected top hit (in duplicates). (C) Infection inhibition analyses. Vero-cSLAM cells were infected with OPneon/nLucP at a multiplicity of infection (MOI) of 0.04 either in absence or presence of either F2261-0043 or F2736-3056 (30 µM). (D) Structures of the compound F2736-3056, F2736-3056, AS-48 and 3G. Scale bars: 2000 μm.

