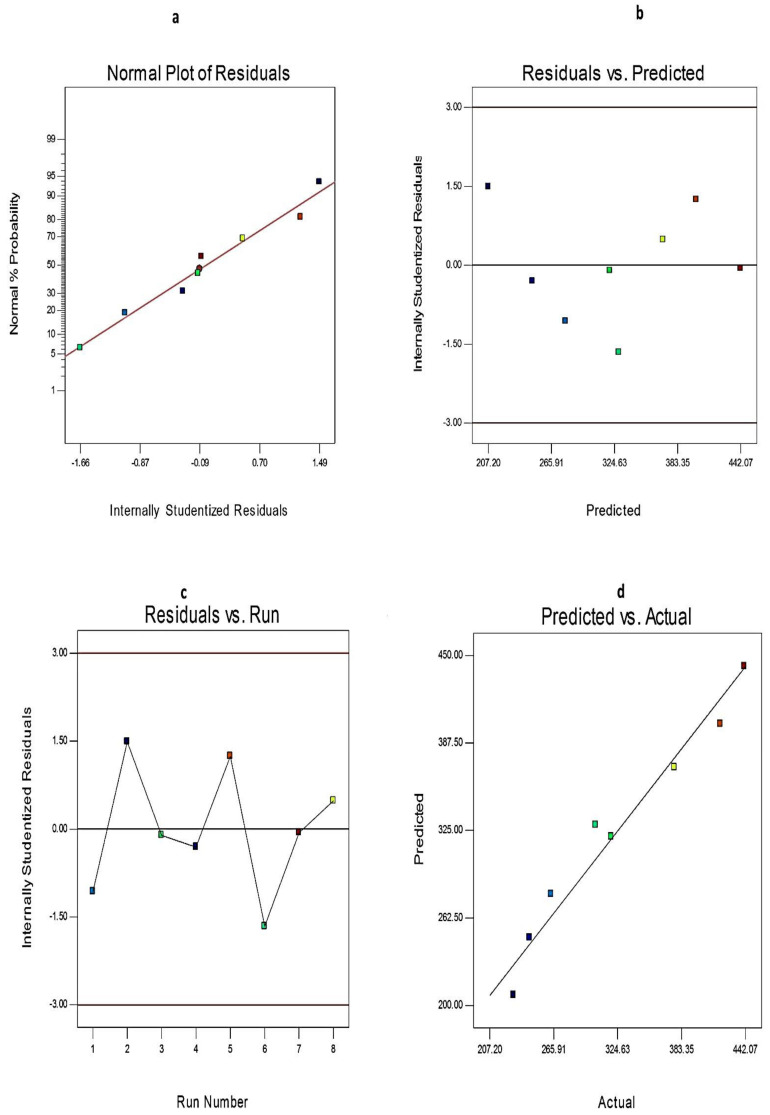
Figure 3.
The diagnostic plots for PS of EGCG-loaded spanlastics (a) plot of normal % probability versus the internally studentized residuals, (b) plot of the internally studentized residuals versus the predicted values, (c) plot of the internally studentized residuals versus the run number, and (d) plot of the predicted versus the actual values. Abbreviation: PS, particle size of EGCG-loaded spanlastics.

