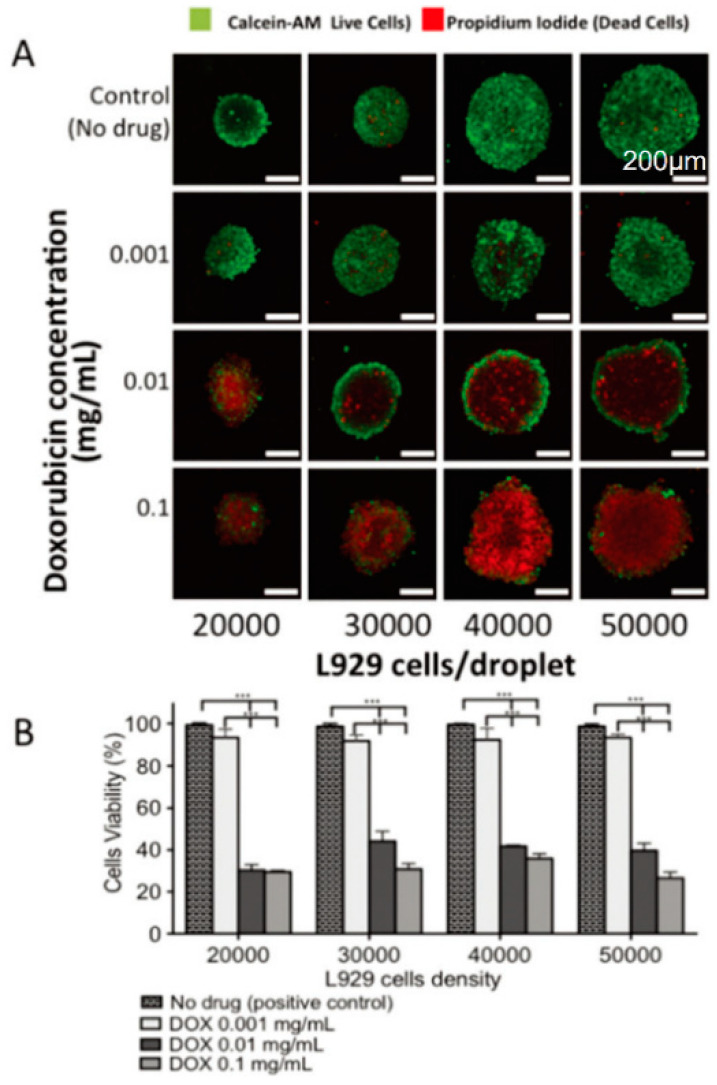
Figure 10.
(A) After being treated with different concentrations of doxorubicin, fluorescence images of the L929 cell spheroids with different densities were obtained using confocal microscopy. (B) Cell viability in the 3D spheroids using different cell densities and concentrations of doxorubicin, obtained using imageJ analysis. (Reproduced from Reference [29]).

