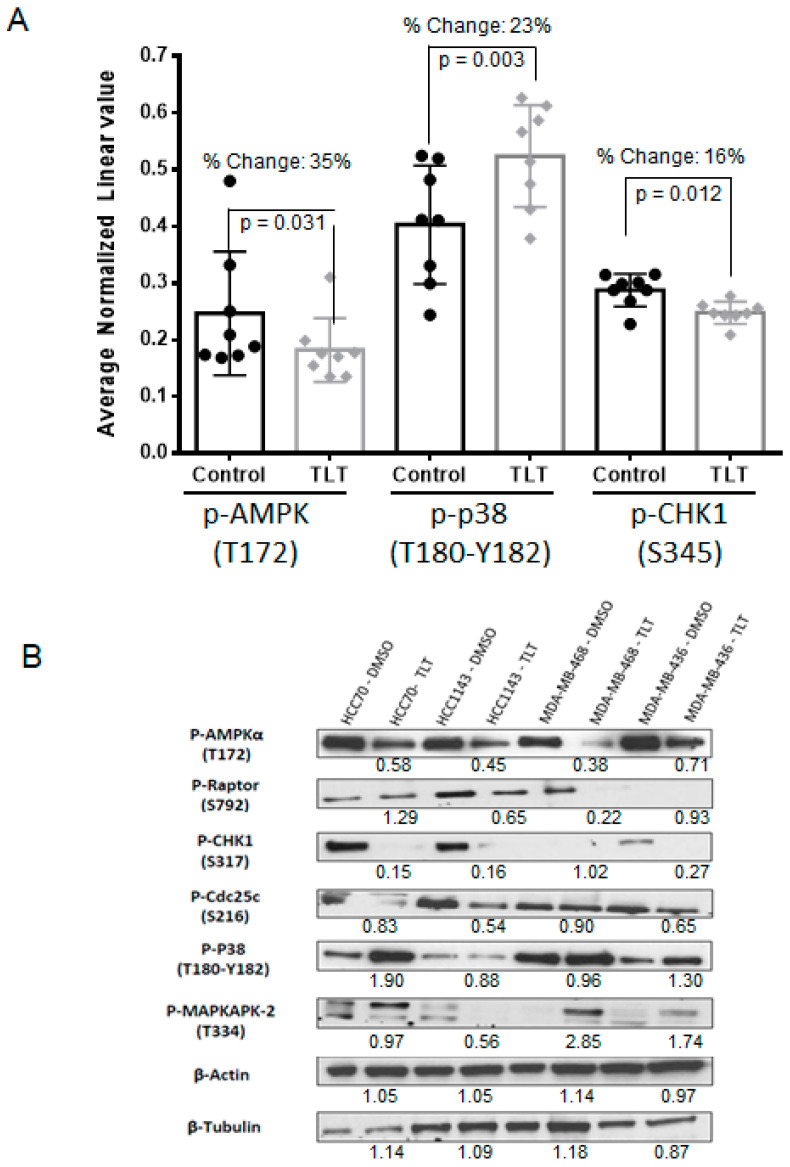
Figure 3.
TLT inhibits AMPK and CHK1 but activates p38. (A) A panel of 8 BL-CL cell lines were treated with TLT at a 105 µM dose (approximate average EC75 dose across all 8 lines) for 6 h and compared with the DMSO control via reverse-phase protein array (RPPA) that investigated 217 proteins. Eight proteins displayed 15% or more significant deregulation in protein levels, among which, AMPK, CHK1, and p38 are displayed here in bar graphs (with standard deviation) with all data displayed as scatter dot diagrams; (B) Observations made for p38, AMPK, and CHK1 in the RPPA experiment were validated by Western blotting. A panel of four BL-CL cell lines were treated similarly with TLT at a 105 µM dose for 6 h and compared to the DMSO control. Beta-actin and β-tubulin were used here as protein loading controls. The values under the TLT treatments are the relative densitometry as compared with the DMSO vehicle treatment for each cell line.

