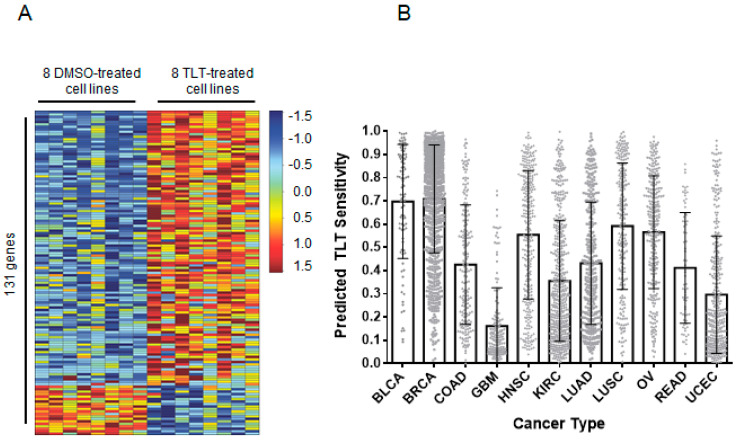
Figure 5.
TLT sensitivity is predicted in breast and bladder cancers using gene-expression signature analysis. (A) The gene-expression signature for TLT sensitivity was generated by treating eight BL-CL cell lines with either TLT or DMSO. The heatmap columns are the eight cell lines making up eight controls on the left (treated with DMSO) and eight treated samples on the right (treated with TLT). Each row represents a gene that is part of the signature. There are a total of 131 genes making up the signature. Red indicates upregulation while blue indicates downregulation of the gene. (B) The TLT sensitivity signature was used to project the sensitivity of twelve different cancers. The results are shown in a bar graph where the x-axis represents the twelve cancer types assayed and the y-axis represents the predicted score of TLT sensitivity (minimum = 0 and maximum = 1). Each column portrays the mean of the TLT sensitivity scores across the samples in a particular cancer type. The error bars indicate the standard deviation. Breast and bladder cancers were predicted to be the most sensitive to TLT treatment, with glioblastoma being the least sensitive. BLCA, bladder urothelial carcinoma; BRCA, breast invasive carcinoma; COAD, colon adenocarcinoma; GBM, glioblastoma multiforme; HNSC, head and neck squamous cell carcinoma; KIRC, kidney renal clear cell carcinoma; LUAD, lung adenocarcinoma; LUSC, lung squamous cell carcinoma; OV, ovarian serous cystadenocarcinoma; READ, rectum adenocarcinoma; UCEC, uterine corpus endometrial carcinoma.

