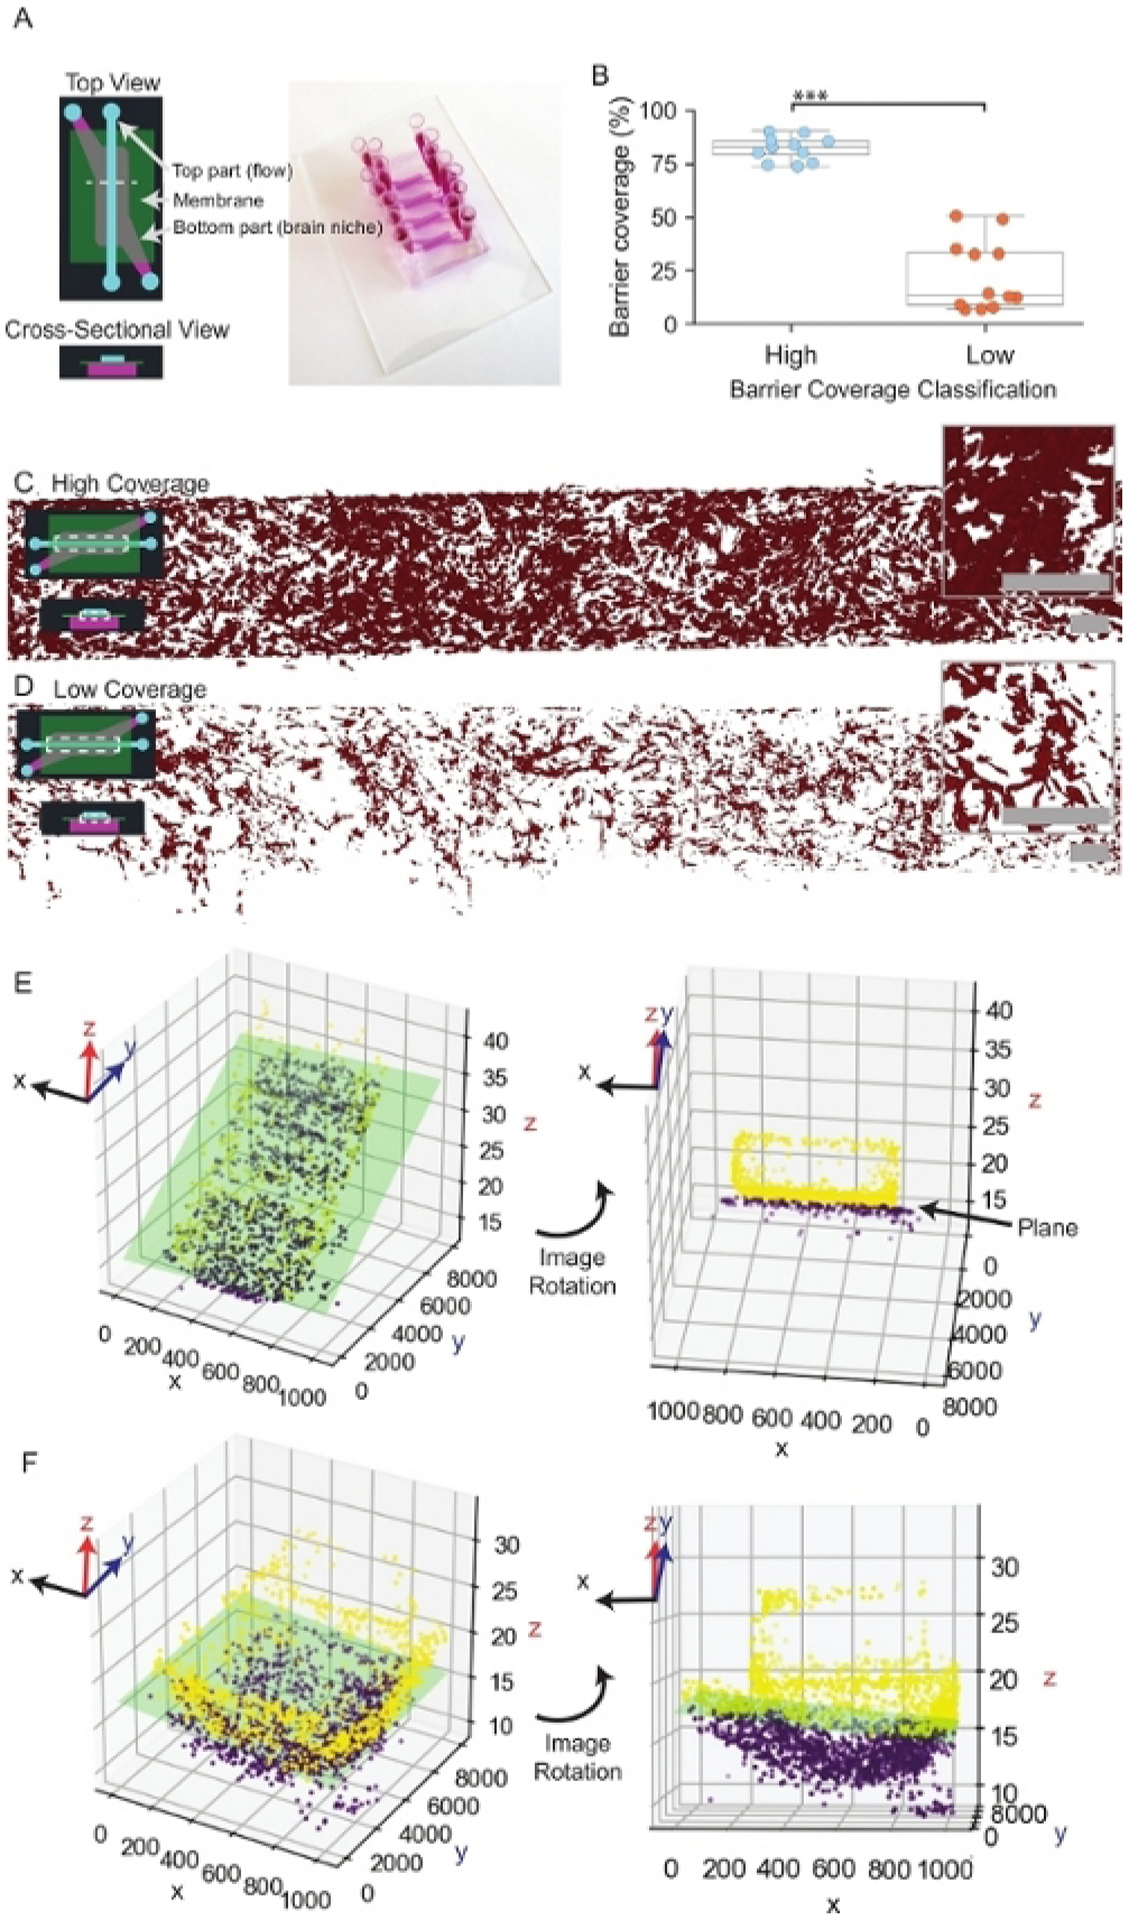
Figure 3: Endothelial barrier coverage and plane fitting.

(A) Representative schematic and image of a μmBBN device. The dashed white line within the top view schematic indicates the area of the device represented in the cross-sectional view. (B) Comparison of high and low endothelial coverage of μmBBN devices prior to the application of cancer cells. Welch two-sample t-test, *** p < 0.1*10−4 . (C) Representative image of high endothelial coverage. The dashed white box within the inset schematic of a μmBBN device indicates the location of the endothelial cells within the device. Scale bars of overview and inset images = 200 μm. (D) Representative image of low endothelial coverage. Scale bars of overview and inset images = 200 μm. (E) Example plane fit of a flat endothelial barrier. The green rectangle represents the position of the endothelial plane. Dots represent single endothelial cells comprising the barrier. Yellow dots are endothelial cells above the plane, and purple dots are cells that fall below the plane. Endothelial cells above the plane (yellow dots) exhibit a tendency to grow up the sidewalls and top of the device to form a tube. (F) Example plane fit of a μmBBN device with a curved plane.
