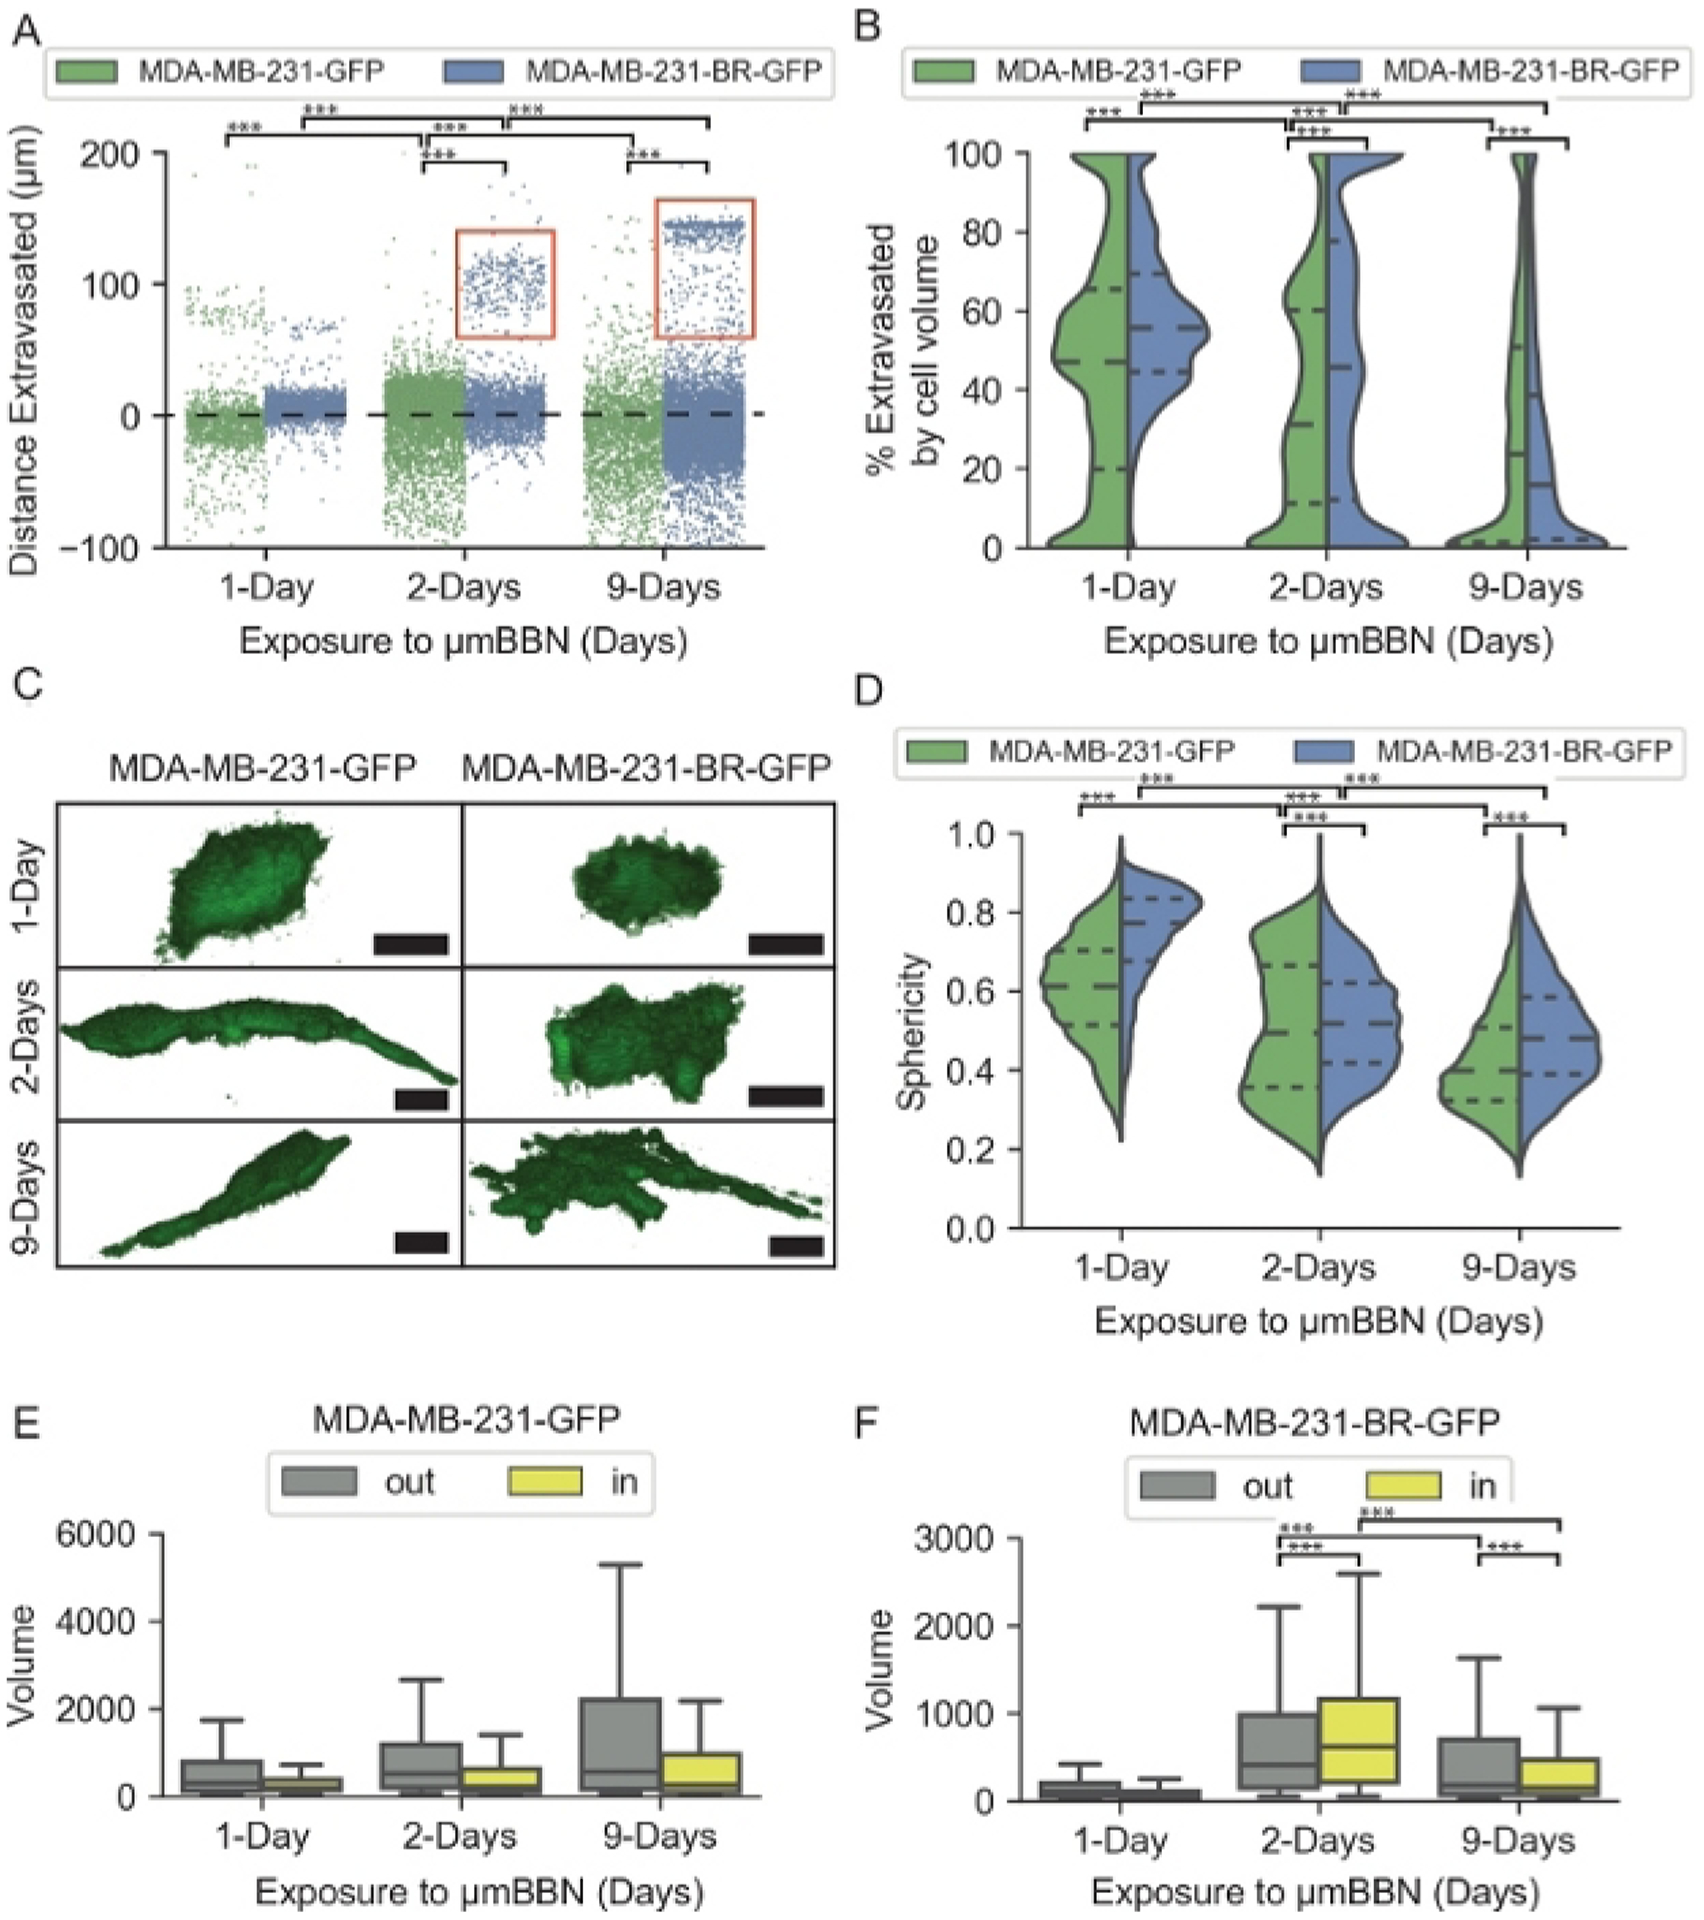
Figure 4: Quantification of cellular phenotypes of brain-metastatic and parental cell phenotypes in astrocytic blood brain niche microfluidic chips.

(A) Strip plot of distance in μm of cancer cells from the endothelial barrier at 1, 2, and 9-Days. The dashed black line at 0 μm represents the endothelial barrier. Red boxes indicate a subset of MDA-MB-231-BR-GFP cells that migrated far into the brain niche. (B) Violin plot of the percent total volume of cancer cells extravasated through the endothelial barrier at 1, 2, and 9-Days. Short dashed lines represent quartiles, longer dashed line represents the mean. (C) Representative images of the morphology of cancer cells in μmBBN device. Scale bar = 25 μm. (D) Violin plot of the sphericity of cancer cells in μmBBN device at 1, 2, and 9-Days. Sphericity ranges from 1: spherical to 0: not spherical. (E) Box plot of MDA-MB-231-GFP cell volume in the μmBBN device in voxels for cells resting outside the endothelial barrier (out) and cells that extravasated through the barrier (in). (F) Box plot of MDA-MB-231-BR-GFP cell volume in the μmBBN device in voxels for cells resting outside the endothelial barrier (out) and cells that extravasated through the barrier (in). The box displays the quartiles and whiskers extend to show the proportion of the interquartile range past the low and high quartiles. Pairwise Wilcoxon Rank Sum and Kruskal-Wallis with Dunn’s multiple comparisons, *** p < 0.1*10−4 . Reproduced from reference24 with permission from the Royal Society of Chemistry.
