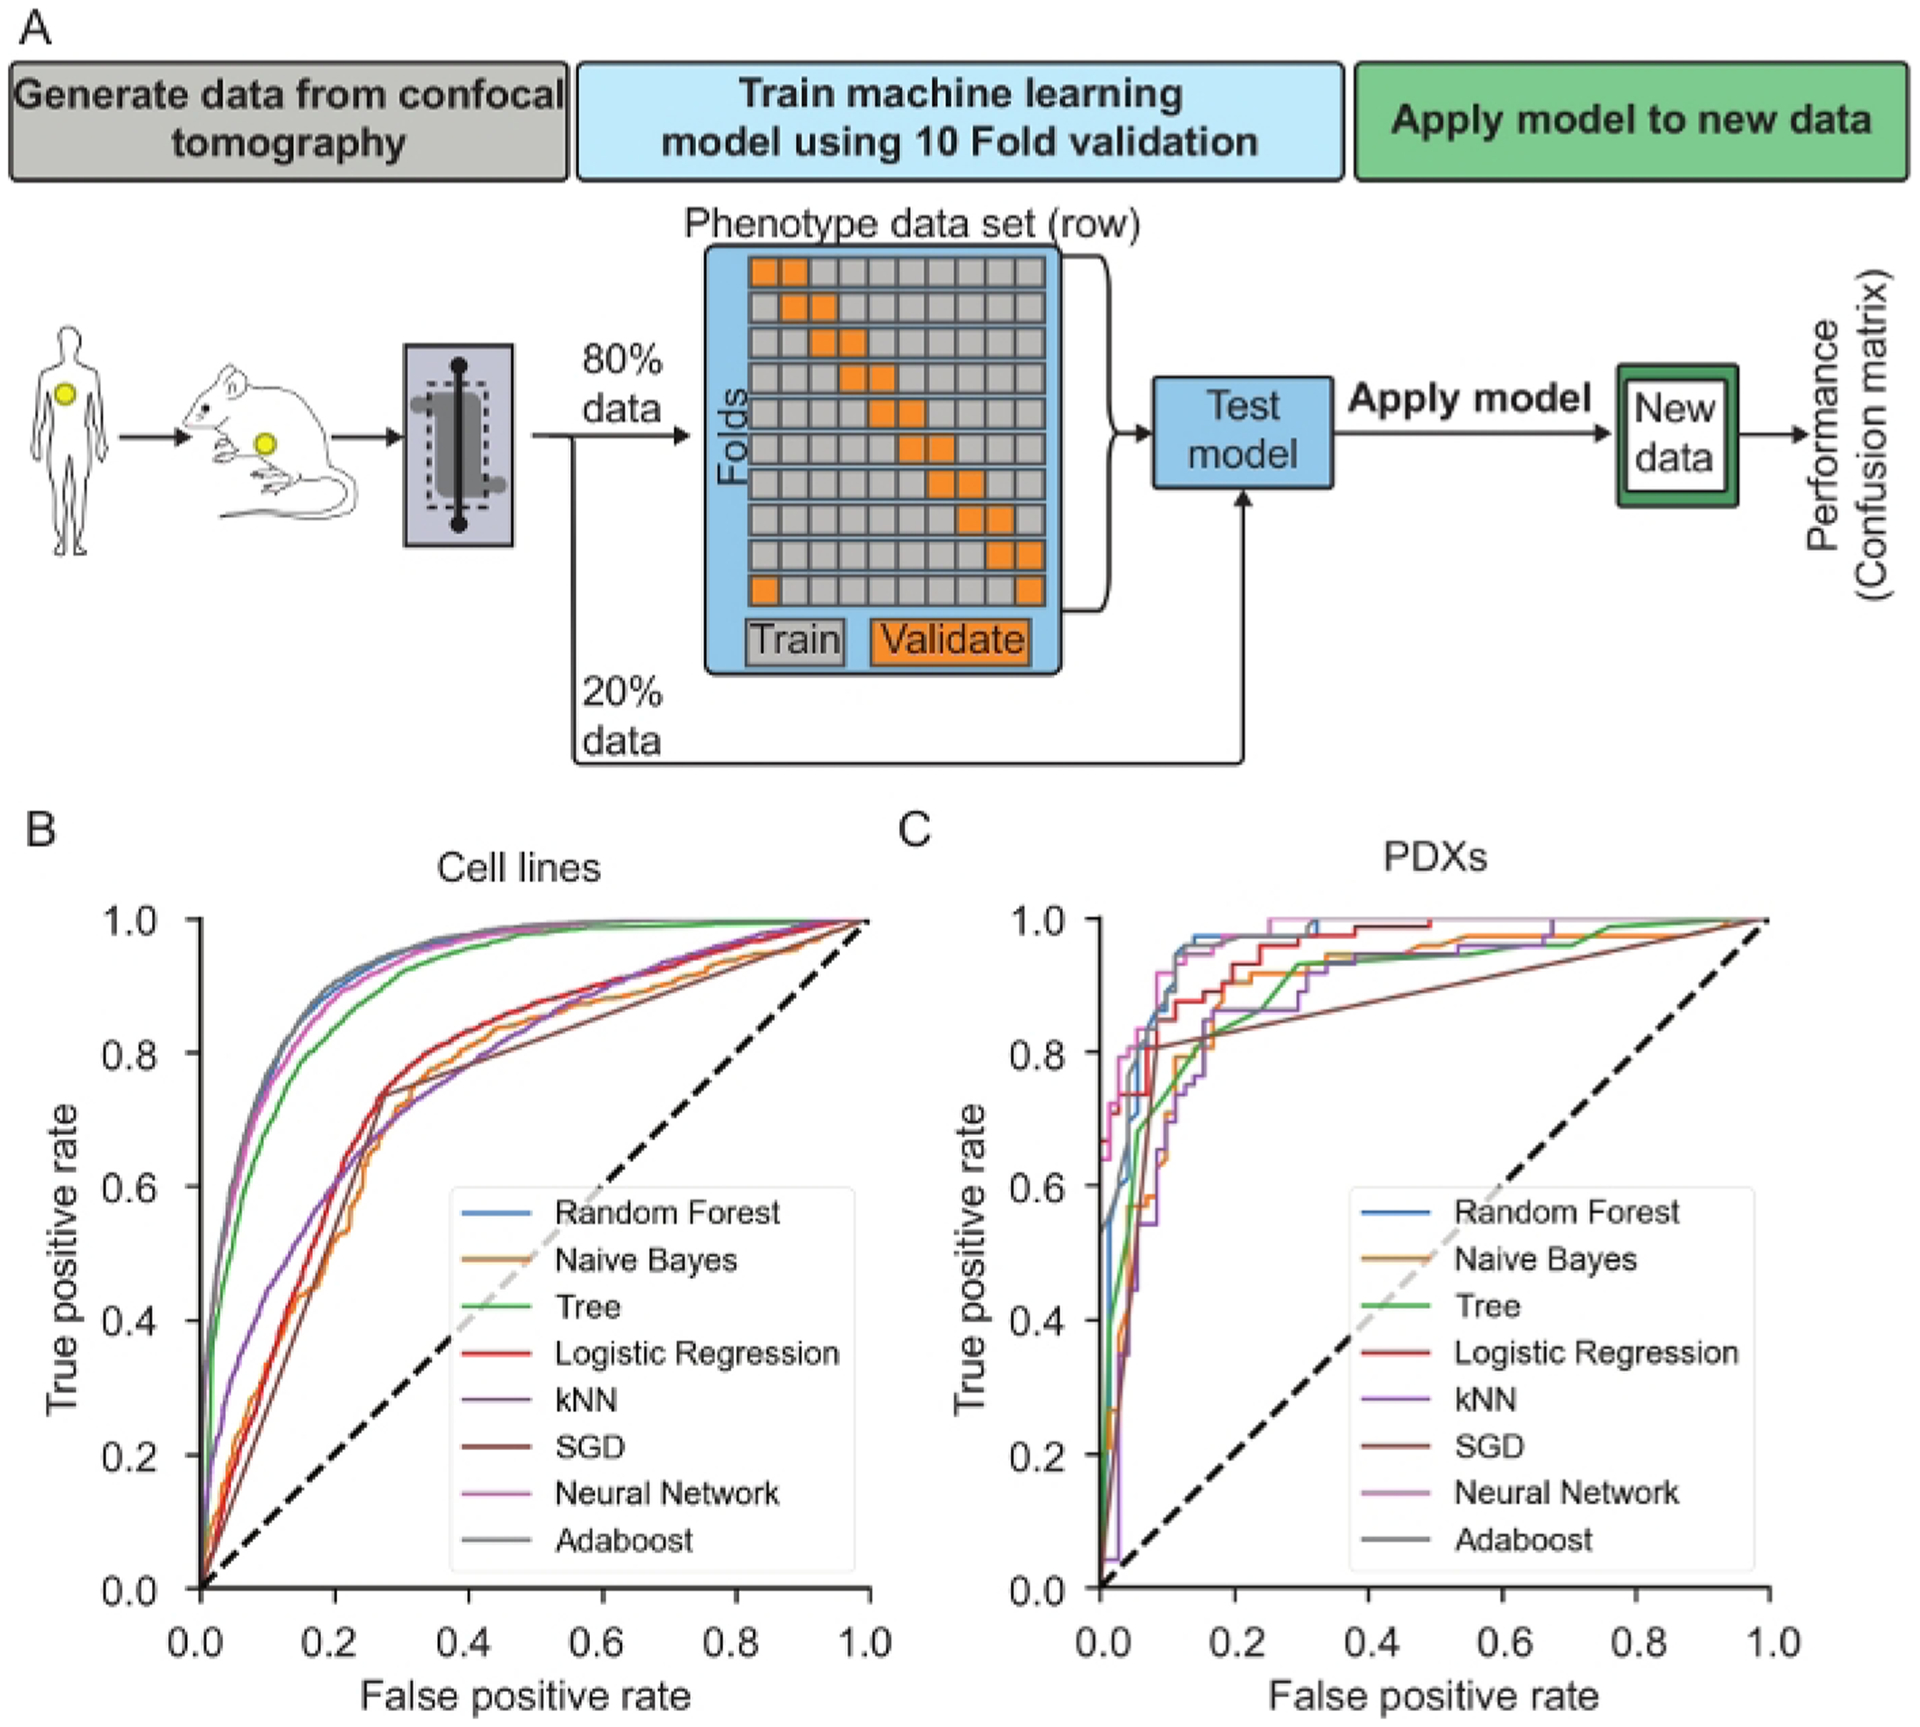
Figure 5: Representative results of machine learning classification of cancer cells.

(A) Machine learning overview. Demonstrates process of splitting data collected from confocal tomography, filtering the data, training the machine learning algorithm using 10-fold validation and then testing the model against a random sample of 20% of the data the was reserved. The selected model can then be applied on new data to collect the metastatic index of individual cells. (B) ROC curves showing the performance of 8 different machine learning algorithms for MDA-231-BR-GFP and MDA-231-GFP cells culture for 1, 2 and 9-Days before imaging. This is representative of the type of curve to be analyzed to understand the performance of the trained model. (C) ROC curves for 8 different machine learning algorithms applied to patient derived xenograft (PDX) dissociated cells cultured for 2-Days. This is representative of the type of curve to be analyzed to understand the performance of the trained model. Reproduced from reference24 with permission from the Royal Society of Chemistry.
