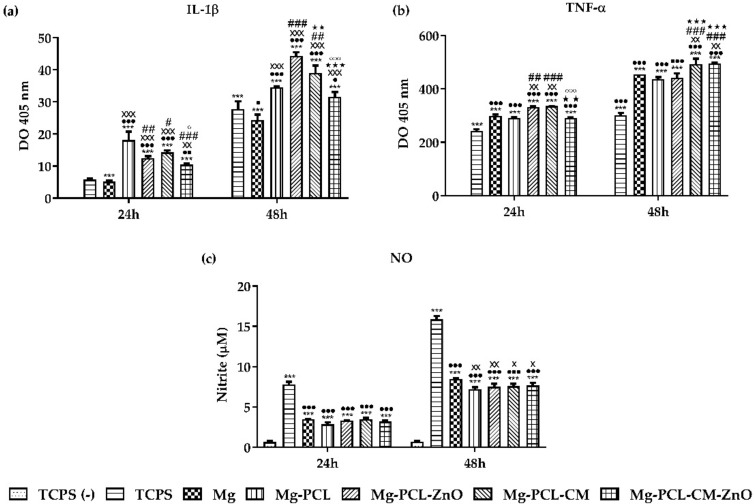
Figure 6.
The extracellular release of the pro-inflammatory mediators under treatment with LPS (100 ng mL−1) with the exception of the TCPS (−) group: (a) IL-1β as assessed by ELISA: *** p < 0.001 vs. TCPS (−); ••• p < 0.001, •• p < 0.01, • p < 0.05 vs. TCPS; xxx p < 0.001, xx p < 0.01 vs. Mg; ### p < 0.001, ## p < 0.01, # p < 0.05 vs. Mg-PCL; ★★★ p < 0.001, ★★ p < 0.01 vs. Mg-PLC-ZnO; °°° p < 0.001, ° p < 0.05 vs. Mg-PCL-CM; (b) TNF-α as assessed by ELISA procedure: *** p < 0.001 vs. TCPS (−); ••• p < 0.001 vs. TCPS; xx p < 0.01 vs. Mg; ### p < 0.001, ## p < 0.01 vs. Mg-PCL; ★★★ p < 0.001, ★★ p < 0.01 vs. Mg-PLC-ZnO; °°° p < 0.001 vs. Mg-PCL-CM; (c) NO as quantified by Griess diazotization reaction: *** p < 0.001 vs. TCPS (−); ••• p < 0.001 vs. TCPS, xx p < 0.01, x p < 0.05 vs. Mg. Results are expressed as means ± SD (n = 3). The TCPS (−) and TCPS notation denotes the negative and positive controls for inflammation, respectively.

