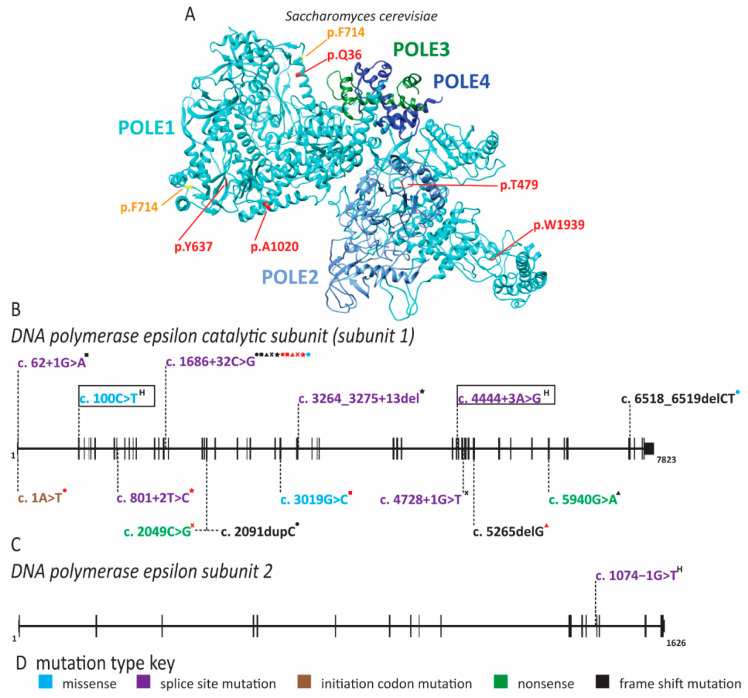
Figure 9.
Pathogenic variants in pol ε cause immunodeficiency. Pathogenic mutations in pol ε subunits are depicted on a schematic of each gene and the crystal structure of Saccharomyces cerevisiae proteins. Mutations that do not have corresponding amino acids in the structure or resulted in abnormal splicing are not depicted. For a complete list of mutations and associated protein changes, see Supplementary Table S1. Structures were generated with the Chimera program (http://www.cgl.ucsf.edu/chimera). Exon and intron schematics were generated with the UCSD genome browser. Reference sequences are POLE1 NM_006231.4 and POLE2 NM_001197331.3. (A) Alignment of Homo sapiens and Saccharomyces cerevisiae POLE1 and POLE2 was completed using UniProt alignment tool (https://www.uniprot.org/align/). Crystal structure of yeast pol ε subunits with amino acids corresponding to missense (red), nonsense mutations (red) and frame shift mutations (orange) depicted. The structure was generated using pdb file 6wjv. Schematic of (B) POLE1 and (C) POLE2 genes depicted with exons as black boxes and introns as horizontal lines. Mutations are mapped to the appropriate gene regions. Boxed alleles on POLE1 occur in individuals with FILS syndrome. “H” superscript indicates a homozygous mutation. Compound heterozygous mutation pairs are indicated by superscript symbols. Each mutation combination is depicted, and certain alleles may be present in multiple combinations such as c.1686 + 32C > G which is shared by all individuals with IMAGe syndrome. The frequency of each allele in the affected population is not indicated. (D) For each gene, the color of the mutations indicates the type of mutation according to this key.

