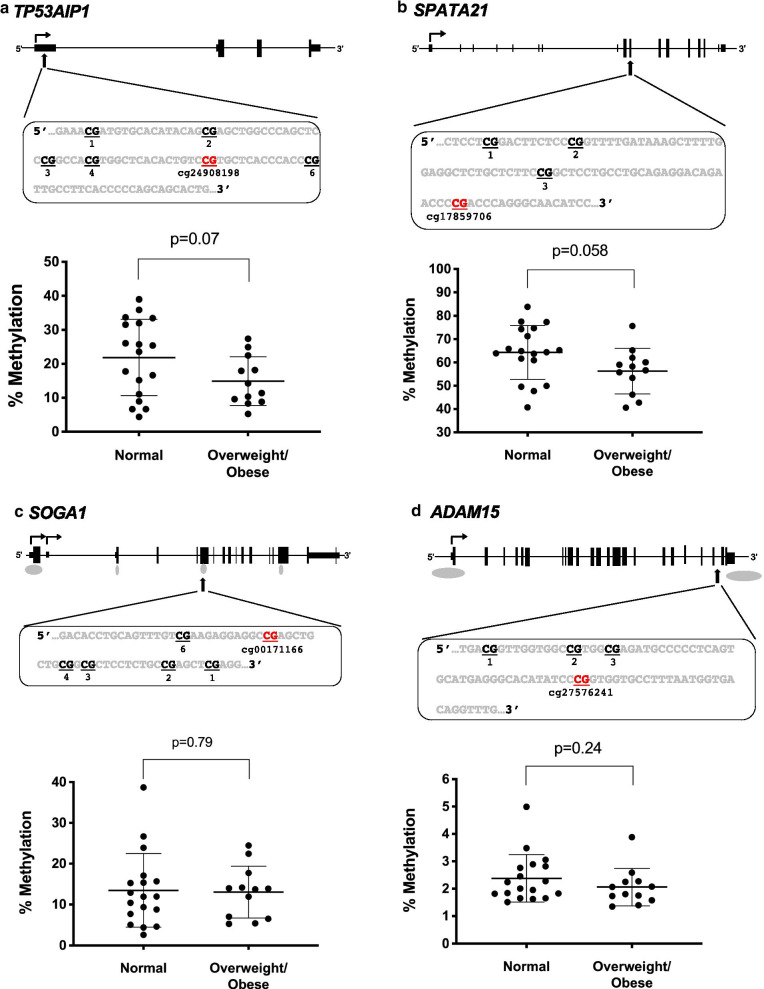
Fig. 3.
Pyrosequencing of candidate CpG sites, comparing values obtained from sperm of men with normal BMIs to those with overweight/obese BMIs. a Pyrosequencing data show differences between men with normal BMI (n = 18) and overweight/obese men (n = 12) for a TP53AIP1 (unpaired t test), b SPATA21 (unpaired t test) but not c SOGA1 (Mann–Whitney test) or d ADAM15 (Mann–Whitney test). The corresponding gene schematics with the sequence to analyze are above each gene, with the CpG site identified via 450K highlighted in red and the probe ID included

