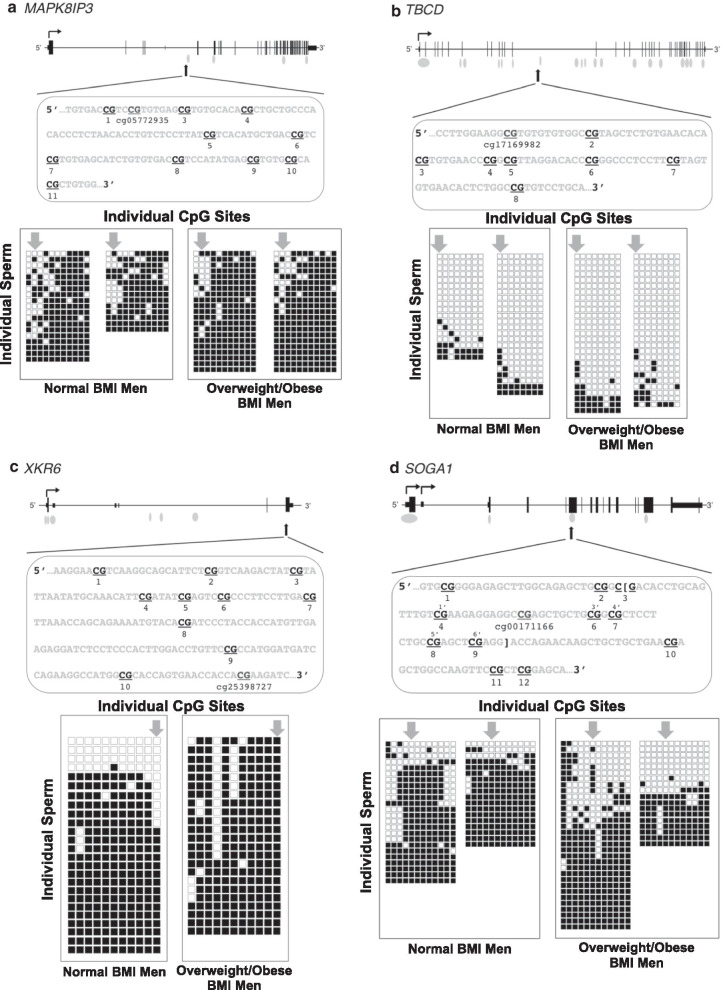
Fig. 4.
Non-random distribution of methylation changes across the sperm population by bisulfite sequencing of cloned alleles. For each gene, the genomic structure and relative position of the region sequenced are shown, with the actual sequence of the region, and CpG sites queried shown below. The CpG that exhibited differential methylation on the Illumina HumanMethylation450 (450K) bead chip is indicated, along with the probe ID. The numbering of the CpGs below the sequence corresponds to each of the CpGs analyzed. For SOGA1, the bracketed sequence and the numbering of CpGs from 1′ to 6′ are the CpG sites analyzed by bisulfite pyrosequencing (refer to Figs. 2 and 3). For each region, the PCR products derived from bisulfite-modified sperm DNA were cloned and sequenced from either two (panel c) or four (panels a, b and d) individuals per region. Results from men with a normal BMI are shown on the left for each gene and men with an overweight/obese BMI are shown on the right. The results for each individual are represented by a tight grouping of boxes, with the columns representing each CpG position in the sequence shown above, with numbering of each CpG from left to right. The rows represent the results for one individual clone. For example, in Panel a, data are shown for two men with normal BMI and two with overweight/obese BMI. There are 11 CpG sites analyzed for each individual, with 19 and 14 alleles, respectively, shown for the two men with normal BMI and 21 alleles each shown for the men with overweight/obese BMI. Filled boxes indicate the CpG is methylated; unfilled boxes indicate the CpG is unmethylated. The arrows point to the individual CpG detected as differentially methylated on the 450K platform

