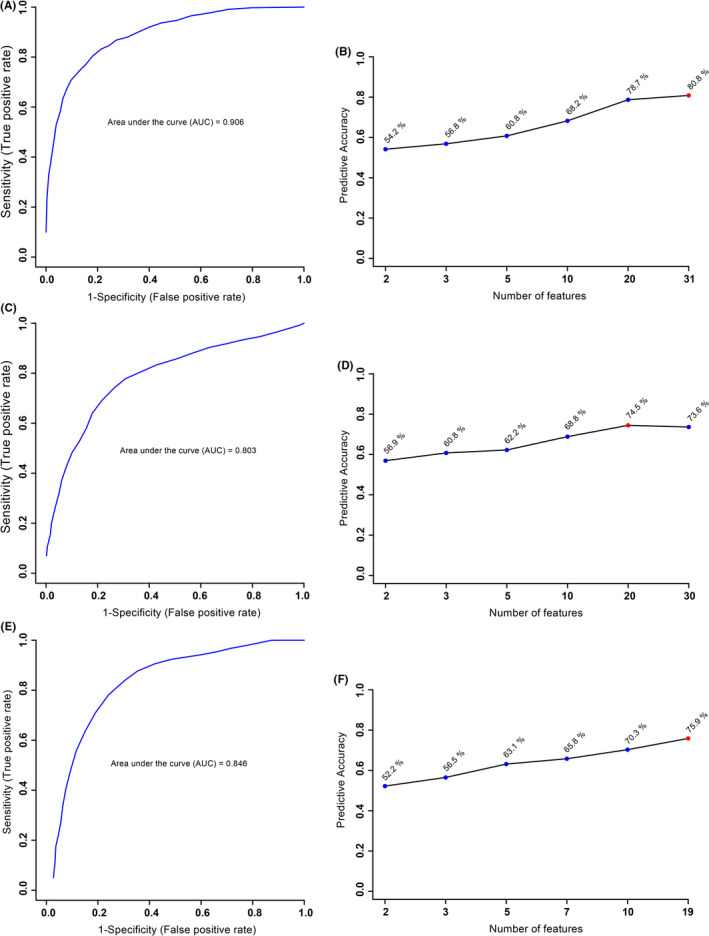
FIGURE 2.

Receiver operating characteristic (ROC) curve (A, C, E) and predictive accuracy (B, D, F) for the comparison of (A, B) obesity and controls, (C, D) GDM and controls, and (E, F) obesity and GDM. These figures were created using the best subset of metabolites as determined by the VIAVC analysis. The 95% confidence intervals for A, C and E are 0.772‐0.986, 0.655‐0.942 and 0.603‐0.962, respectively
