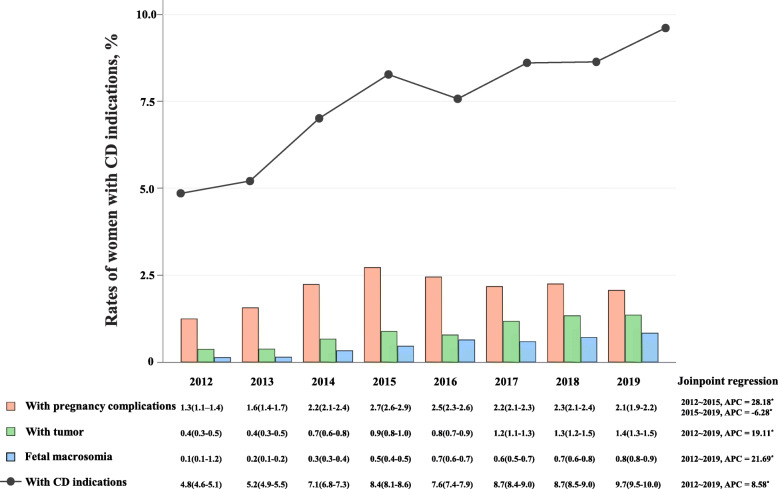
Fig. 4.
Secular trends in the incidence rate of each indication among the general population from 2012 to 2019, by year. Gray circles: annual incidence rates of the overall CD indications; orange blocks: annual incidence rates of women with pregnancy complications; green blocks: annual incidence rates of women with tumor; blue blocks: annual incidence rates of fetal macrosomia. The annual incidence rate and its 95% CI were listed below. Annual percentage change (APC) of the incidence rates of each indications estimated by joinpoint regression models was shown

