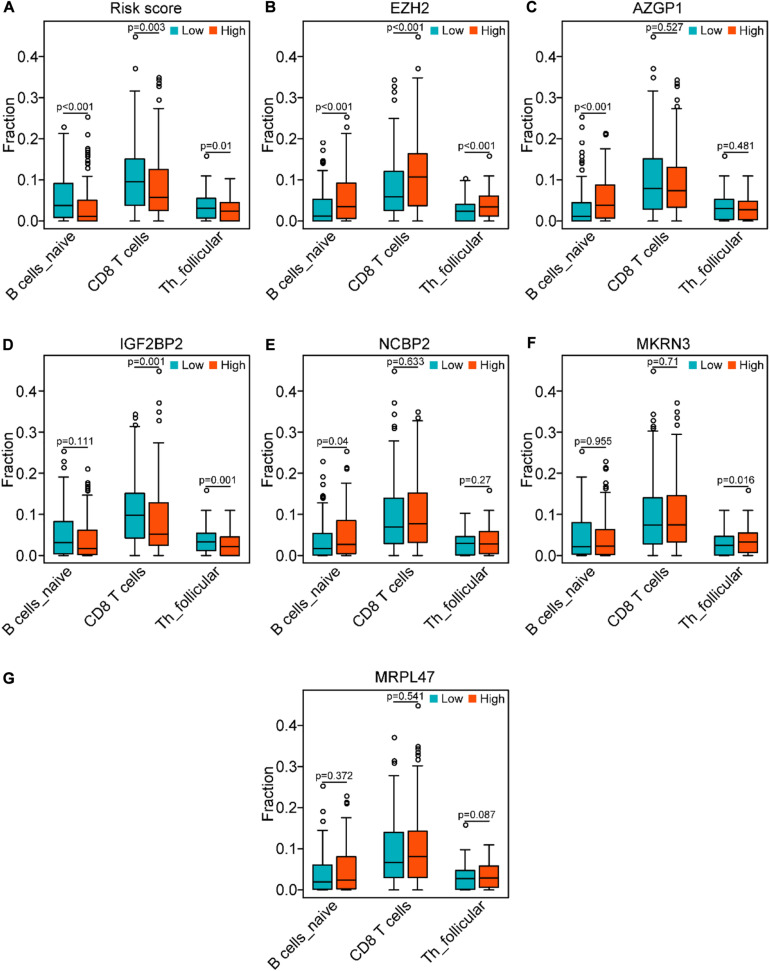
FIGURE 10.
Correlation of the genes of the risk model with the three immune cells in the TCGA data set. (A) Comparison of the three immune cells (naïve B cells, CD8 T cells, and follicular helper T cells) between the high-risk and low-risk groups. (B–G) Distribution of the three immune cells in the subgroups with high or low expression of EZH2, AZGP1, IGF2BP2, NCBP2, MKRN3, and MRPL47, respectively.

