
Figure 5.
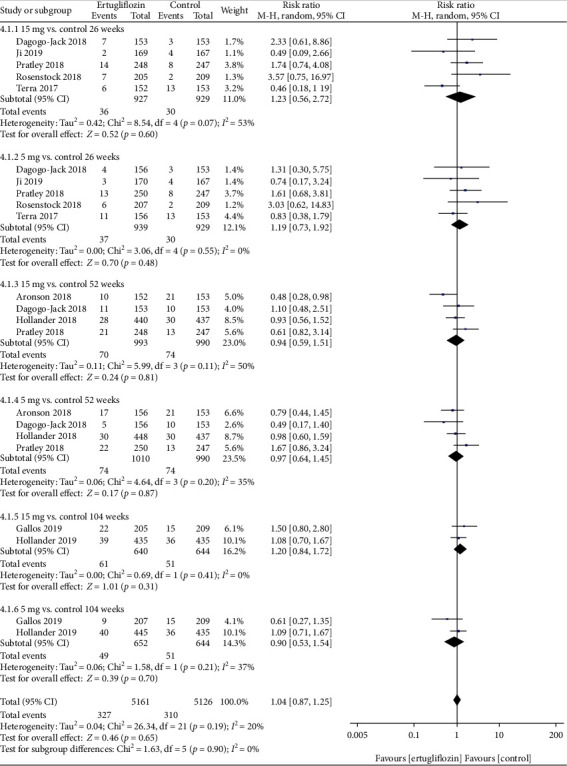
Forest plot of the risk of UTIs in the 15 mg and 5 mg dose groups compared with that in the control group at 26, 52, and 104 weeks. CI: confidence interval; M-H: Mantel-Haenszel.
Official websites use .gov
A
.gov website belongs to an official
government organization in the United States.
Secure .gov websites use HTTPS
A lock (
) or https:// means you've safely
connected to the .gov website. Share sensitive
information only on official, secure websites.
Forest plot of the risk of UTIs in the 15 mg and 5 mg dose groups compared with that in the control group at 26, 52, and 104 weeks. CI: confidence interval; M-H: Mantel-Haenszel.