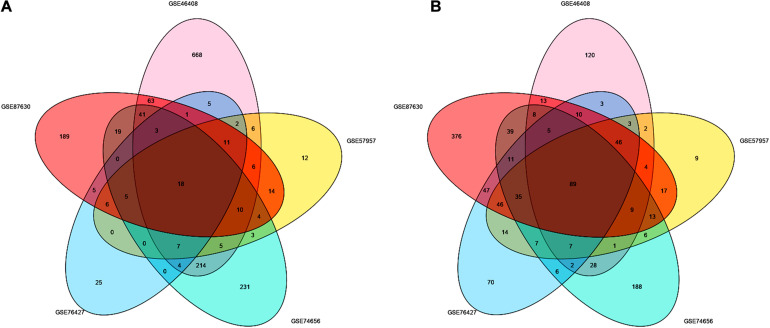
FIGURE 1.
Identification of the DEGs between liver tumor and non-cancerous tissues in GSE46408, GSE57957, GSE74656, GSE76427, and GSE87630. Venn diagram of (A) upregulated and (B) downregulated DEGs based on the five GEO datasets. The overlapping areas represent the commonly altered DEGs. The t-test was used to analyze DEGs, with the cutoff criteria of |log FC| > 1.0 and adjusted p < 0.05. DEGs, differentially expressed genes; GEO, Gene Expression Omnibus; log FC, log fold change.

