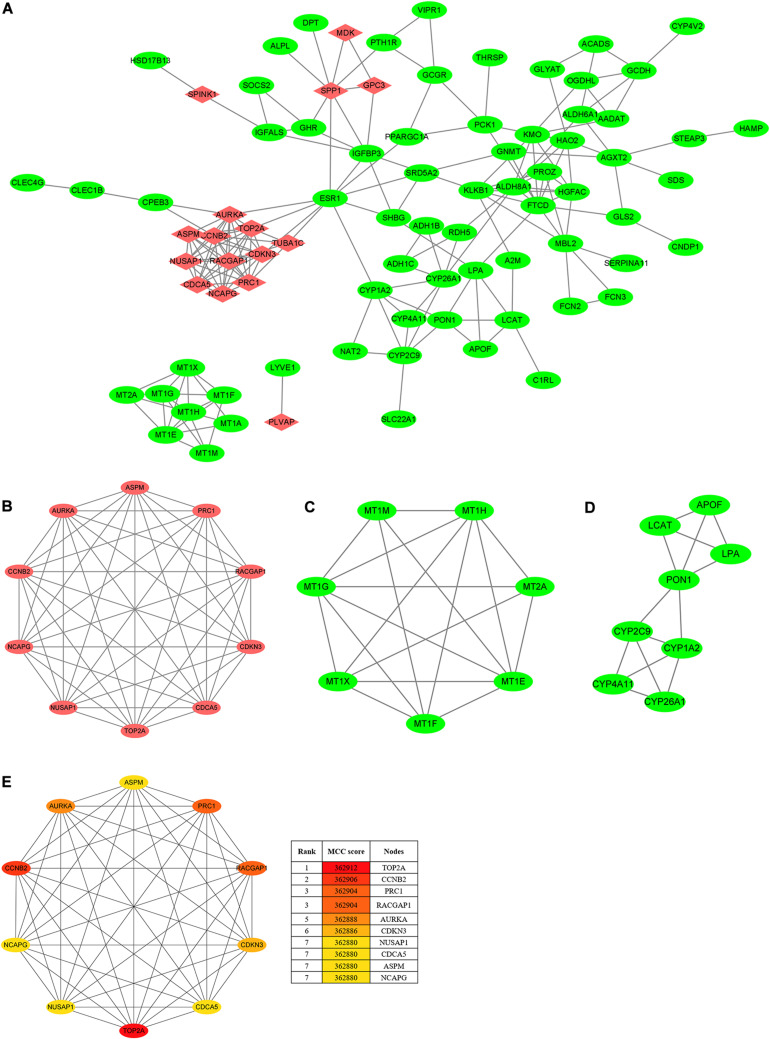
FIGURE 3.
PPI network and clusters identification. (A) The PPI network of DEGs was constructed using Cytoscape. Upregulated genes are marked in red, and downregulated genes are marked in green. (B) Cluster 1 with 10 nodes and 45 edges. (C) Cluster 2 with 7 nodes and 18 edges. (D) Cluster 3 with 8 nodes and 14 edges. MCODE plugin was employed for the detection of clusters. Upregulated genes are marked in red, and downregulated genes are marked in green. (E) The top ten hub genes were identified using CytoHubba and ranked by the MCC score. The hub-gene network from CytoHubba analysis completely coincided with the Cluster 1 from MCODE analysis, both of which included the same 10 nodes and 45 edges. PPI, protein–protein interaction; DEGs, differentially expressed genes; MCODE, molecular complex detection; MCC, maximal clique centrality.

