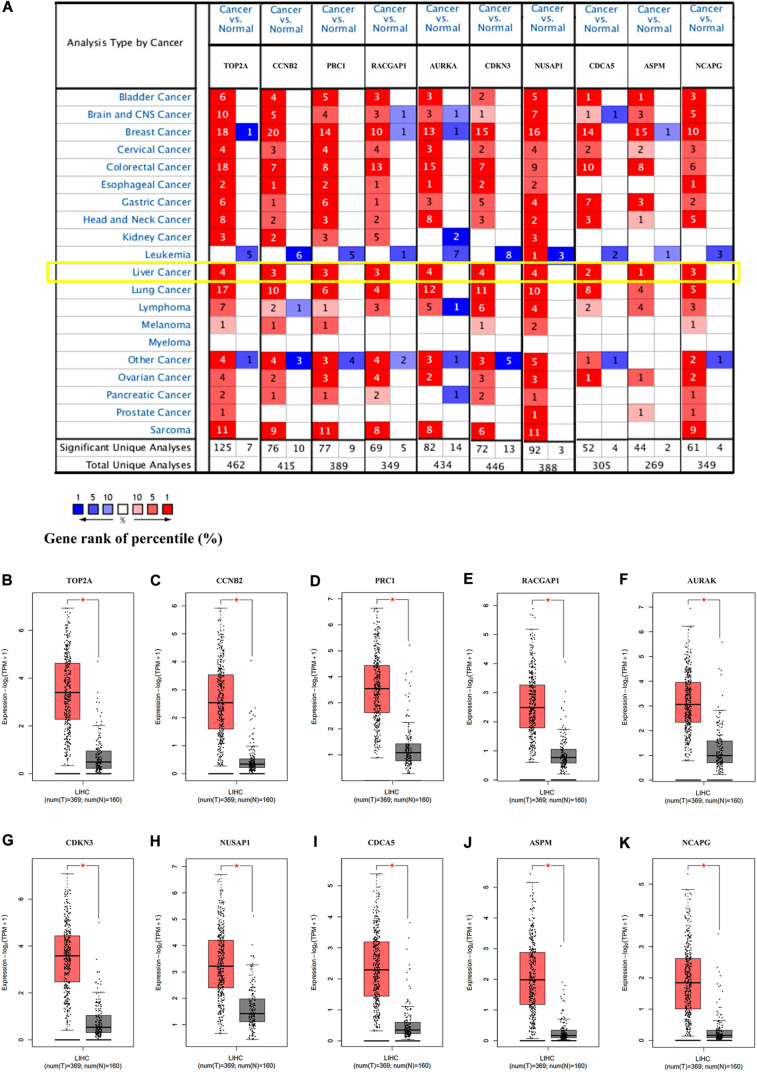
FIGURE 4.
The expression of the hub genes was validated in HCC tissues. (A) The mRNA expression patterns of hub genes in the Oncomine database. This figure shows the numbers of datasets with statistically significant mRNA overexpression (red) or under-expression (blue) of the target gene (cancer vs. normal). The p value threshold is 0.0001. The number in each cell represents the number of analyses that met the threshold within the analyses and cancer types. The mRNA expression levels of (B) TOP2A, (C) CCNB2, (D) PRC1, (E) RACGAP1, (F) AURKA, (G) CDKN3, (H) NUSAP1, (I) CDCA5, (J) ASPM, and (K) NCAPG in LIHC tissues and normal liver tissues using GEPIA2. *p < 0.01 was considered statistically significant. HCC, hepatocellular carcinoma; LIHC, liver hepatocellular carcinoma. The “Yellow Box” specified the mRNA expression of these hub genes in liver cancer.

