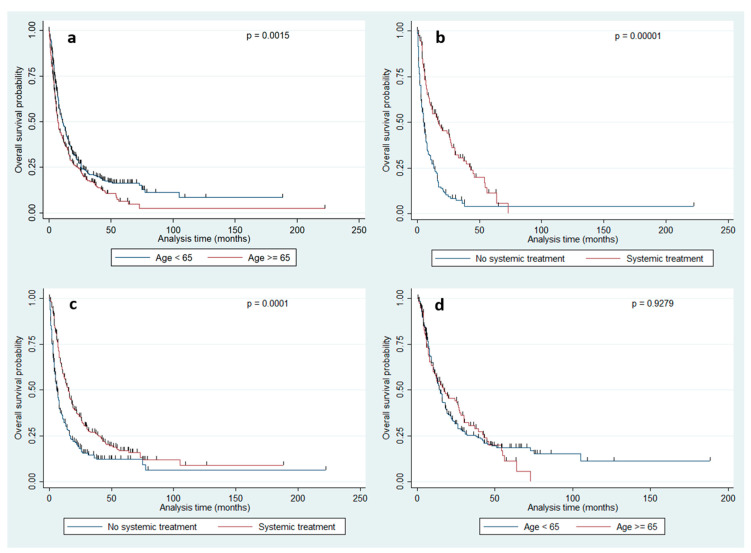
Figure 2.
(a) Overall survival of the entire population (n = 807) stratified by age group (younger Table 65. years vs. 65 years and older). The elderly population shows a significantly poorer overall survival (median OS: 5.81 vs. 8.83; p = 0.0015). (b) The comparison of overall survival between patients who received systemic treatment or not applied to the entire population showed a significantly better outcome in patients receiving such treatment (median OS: 15.38 vs. 6.99 months, p = 0.00001). (c) The identical comparison applied to the elderly population confirmed the effects of systemic effect on overall survival (median OS: 10.33 vs. 3.87 months, p = 0.0001). (d) When analyzing only patients who received systemic treatment, no significant impact of age group was detectable anymore (p = 0.927).

