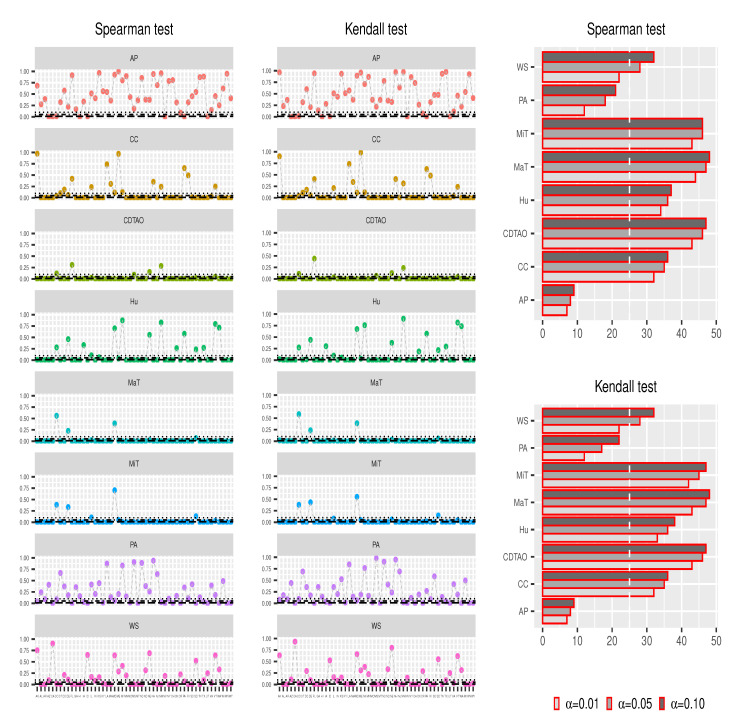
Figure 3.
State-level Spearman and Kendall test results. Scatter plots show the related p-value, and bar plots show the related number of states that are significantly influenced by related factors with , and , respectively, which are drawn with dotted black lines. The white dotted lines in the bar plots are equal to 25, which is approximately half of the total number of analyzed states. Maximum temperature (MaT), minimum temperature (MiT), humidity (Hu), the probability of precipitation appearance (PA), the percentage of cloud coverage (CC), sea-level air pressure (AP), wind speed (WS), and the columnar density of total atmospheric ozone (CDTAO)

