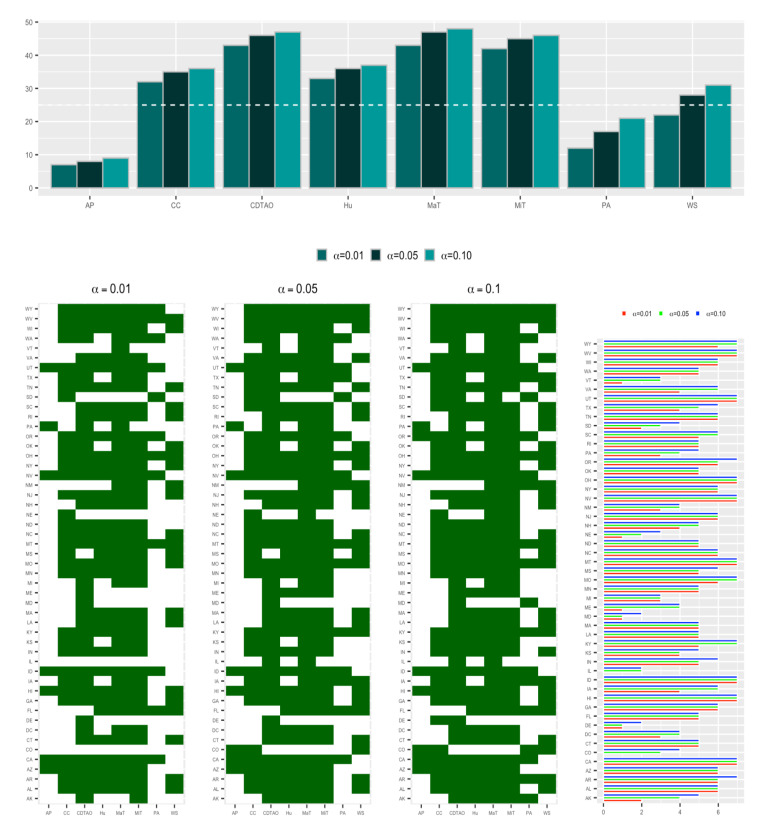
Figure 4.
State-level combination of Spearman and Kendall tests. Two-dimensional barcode plots show whether a factor is significantly associated with a state by both the Spearman and Kendall tests (with squares in dark green color). The bar plot represents the number of states that are significantly associated with each factor with , and , respectively, by both the Spearman and Kendall tests. The horizontal line in the top subplot is equal to 25, which is approximately half of the total number of analyzed states.

