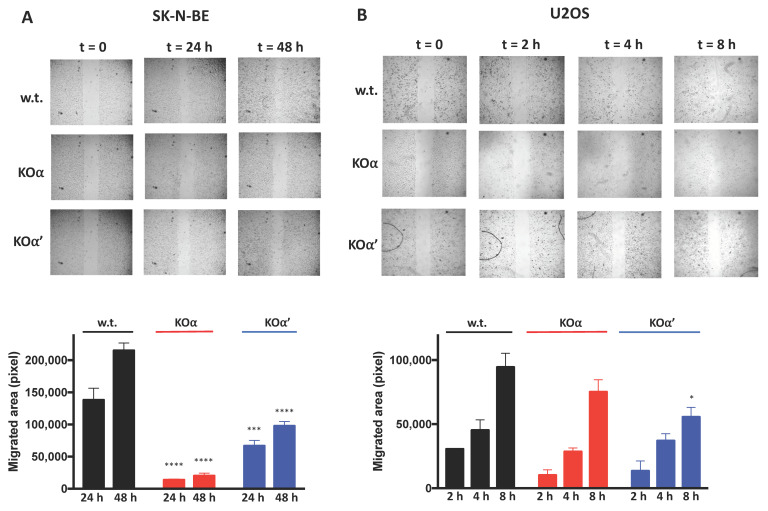
Figure 5.
Migration of w.t. and KO clones of (A) SK-N-BE (KOα clone 1, KOα’ clone 1) and (B) U2OS (KOα clone 1, KOα’ clone 2) cells. Cell migration was assessed by wound-healing assay. Images were taken at the indicated times after the removal of the insert (t = 0). The experiments were performed three times. Representative images are shown. The bar graphs on the bottom show the quantification of the migrated areas of at least 2 different experiments, each one performed in triplicates (see Section 2 for details). Significance refers to the corresponding time in w.t. cells. (*) p < 0.05, (***) p < 0.001, (****) p < 0.0001.

