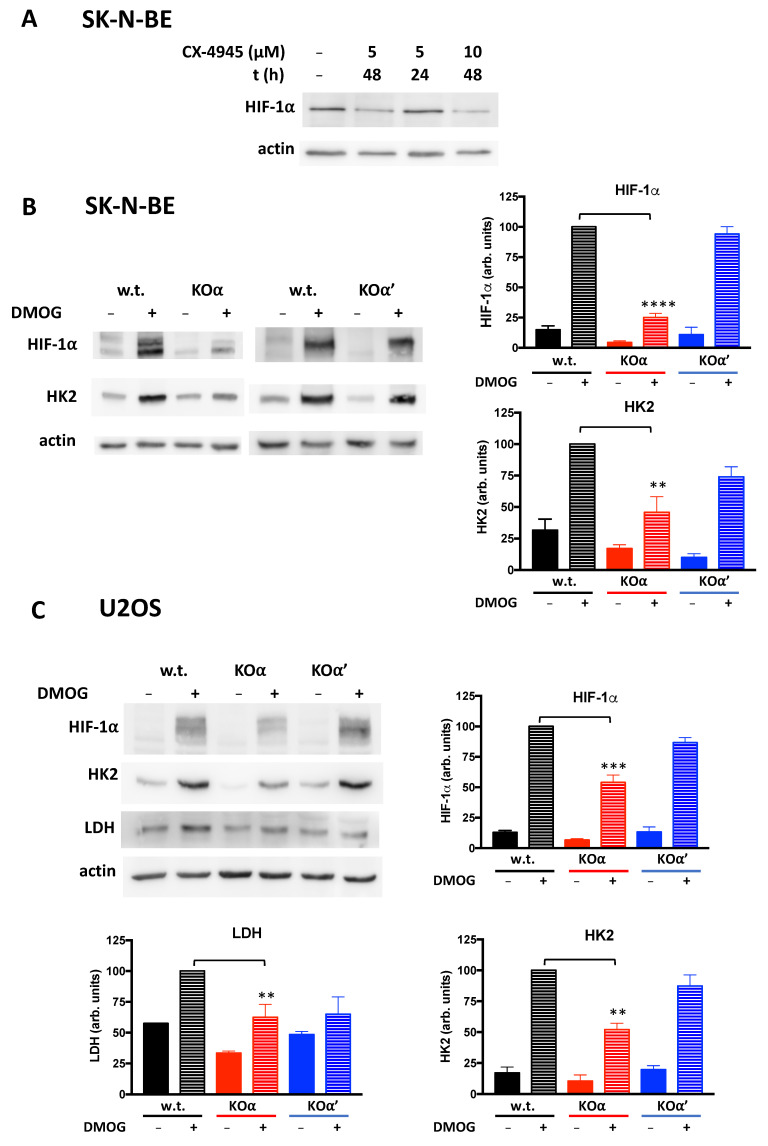
Figure 6.
HIF-1α levels in w.t. and KO clones of SK-N-BE and U2OS cells. (A) w.t. SK-N-BE cells were treated with CX-4945 at the indicated time and concentration conditions. 30 μg proteins from lysates were analyzed by WB for the HIF-1α levels. Actin was used as loading control. (B) SK-N-BE cells (w.t or KOα clone 1, or KOα’ clone 1) or (C) U2OS cells (w.t or KOα clone 1 or KOα’ clone 2) were treated, where indicate (+), with 2mM dimethyloxallyl glycine (DMOG) for 20 h. 30 μg proteins from cell lysates were analyzed by WB for the indicated proteins. Actin was used as loading control. At least three independent experiments (also with different clones) were performed. Representative WB are shown. The bar graphs report quantification of HIF-1α, HK2 and LDH, as normalized mean values ± SEM of all experiments, in arbitrary units, obtained by analyses with Kodak 1D Image software. Significance refers to the corresponding condition in w.t. cells. (**) p < 0.01, (***) p < 0.001, (****) p < 0.0001.

