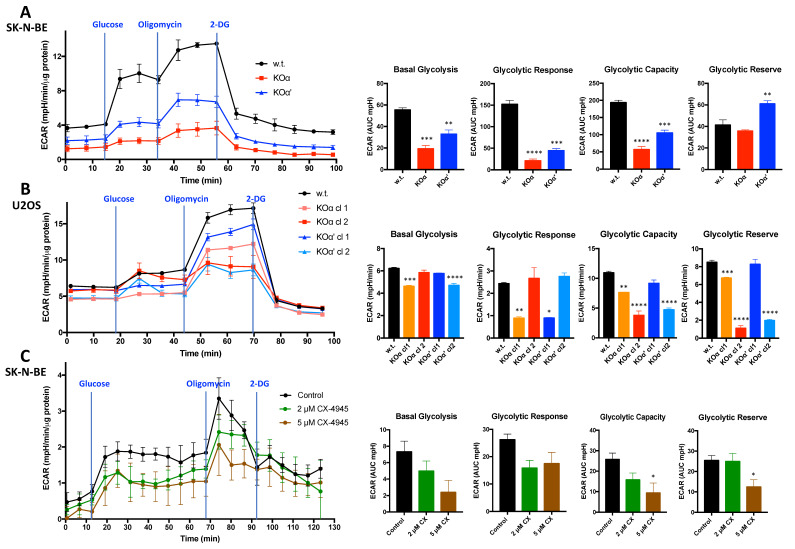
Figure 8.
Seahorse glycolytic stress test of w.t. and KO clones of SK-N-BE and U2OS cells. The glycolysis stress tests were performed using a Seahorse extracellular flux analyzer. ECAR (extracellular acidification rate) was monitored following the indicated additions and normalized to protein concentrations. Each experiment was performed at least in quadruplicate. Values are expressed as the mean ± SEM. At least two independent experiments were performed; representative profiles are shown. (A) SK-N-BE cells glycolytic stress test profile (left) (KOα clone 1, KOα’ clone 2) and quantification of the experiment (right), performed with the XF software. ECAR values are expressed in AUC (Area Under Curves) units, quantifying the area of the curves corresponding to the different phases of the experiment (see Section 2). Significance refers to w.t. cells; (B) U2OS cells glycolytic stress test profile (left) (w.t. cells or the indicated clones) and quantification of the experiment (right), performed with the Wave software. ECAR values are expressed in mpH/min, as detected at the last measure point of each phase of the experiment (see Section 2). Significance refers to w.t. cells; (C) SK-N-BE cells glycolytic stress test profile, upon treatment with vehicle (control) or the indicated concentration of CX-4945 for 5 h before running the Seahorse experiment (left). Quantification of the experiment is shown on the right, performed with the XF software. ECAR values are expressed in AUC (Area Under Curves) units, quantifying the area of the curves under three points of each phases of the experiment (see Section 2). Significance refers to vehicle-treated control cells. (*) p < 0.05, (**) p < 0.01, and (***) p < 0.001, (****) p < 0.0001.

