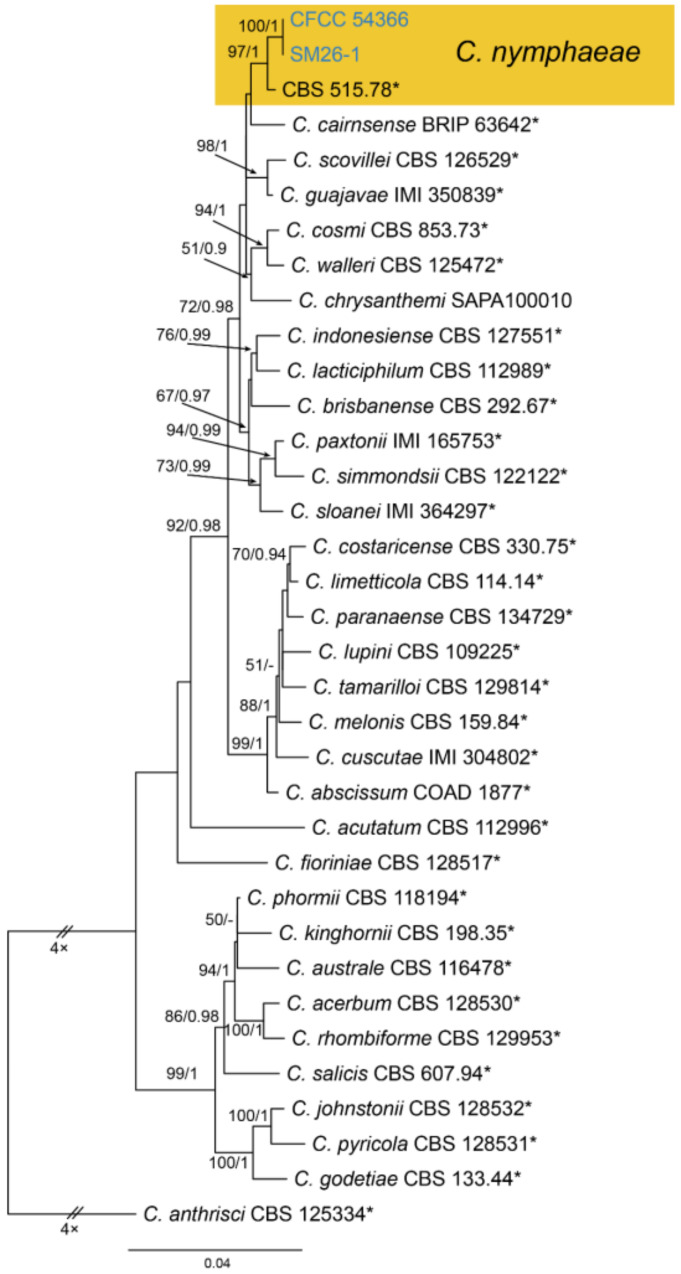
Figure A15.
Phylogram generated from RAxML analysis based on combined ITS, act, chs-1, gapdh and tub2 sequence data of Collectrichum acutatum species complex isolates. The tree was rooted to Collectrichum anthrisci (CBS 125334). The scale bar indicates 0.04 nucleotide changes per site. Isolates from this study are marked in blue, ex-type strains are marked with *, and the identified species is marked in yellow.

