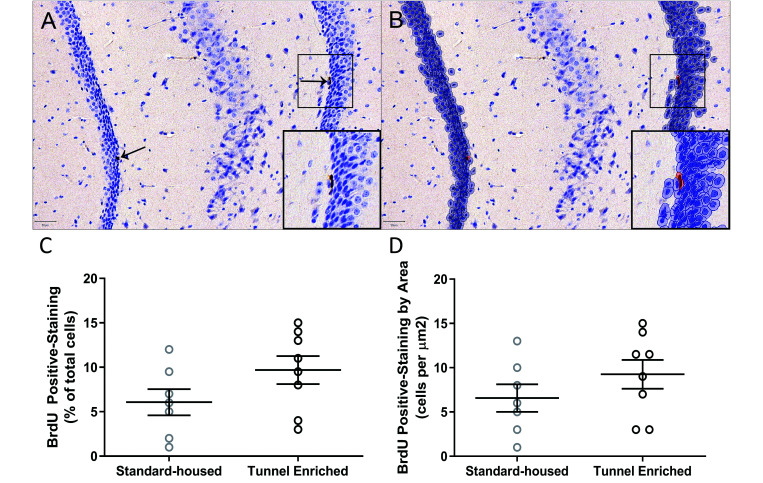
Figure 2.
Representative quantitative BrdU immunohistochemistry (scale bars = 50µm) and results (n = 15; 3 brain sections per mouse; means ± SEM). (A) Few BrdU immunolabeled nuclei were present in the subgranular zone and migrating into the granular cell layer of the dentate gyrus (arrows). (B) Following region of interest delineation and positive cell detection analysis in QuPath, a mockup image quantifying total number of negative (blue) and positive (red) cells was created. There was not a statistically significant effect of tunnel enrichment on either the (C) percent of BrdU positive cells per total number of cells analyzed (P = 0.13) or (D) the total number of BrdU positive cells per µm2 (P = 0.27) as determined by Mann–Whitney U test.

