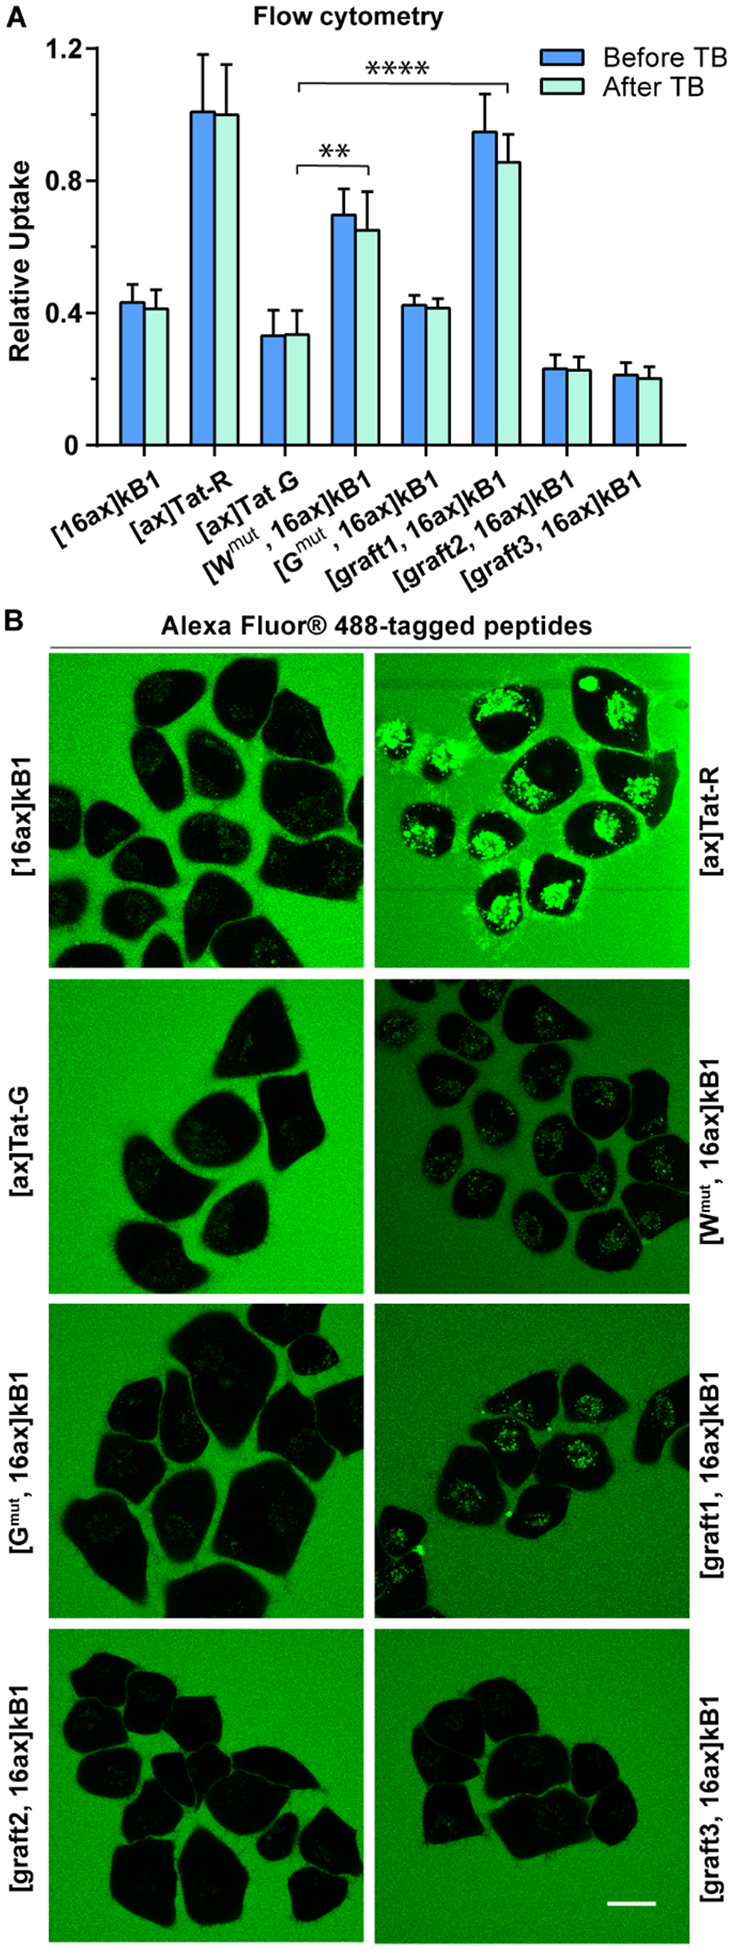
Figure 6.

Total cellular uptake of kB1 residue mutants and grafted peptides. Uptake was measured for Alexa Fluor 488-tagged peptides at 4 μM using flow cytometry and microscopy. (A) Flow cytometry results before (blue) and after (green) the addition of TB. The mean fluorescence signal of cells treated with [ax]Tat-R after the addition of TB was used for normalization. All experiments were repeated in triplicate, and the results are represented as mean ± SEM. (B) Images of live cells captured using confocal microscopy of cells incubated with Tat-peptides and selected kB1 analogues. Images were acquired post addition of peptides, scale bar = 20 μm.
