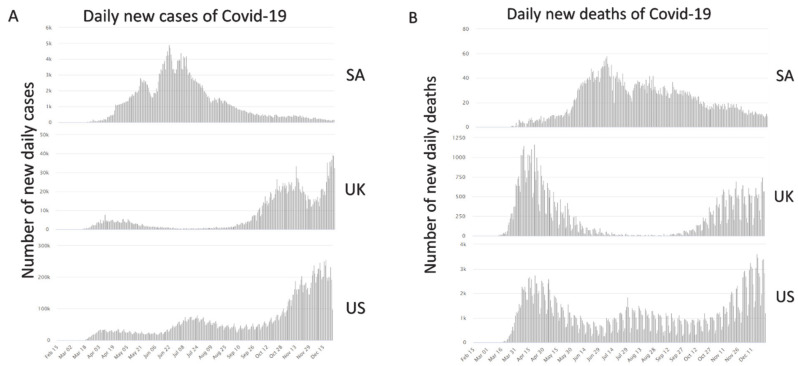
Figure 2.
Daily new cases and deaths of Covid-19 in Saudi Arabia in comparison to UK and US. (A) The 3 graphs demonstrate the number of daily new cases in SA compared to UK and US. The peak number of new daily cases in SA is significantly less than UK and US. Such difference can be appreciated by the vast difference in the labeling of the Y axis. Similarly, (B) the peak number of daily deaths of Covid-19 infections in SA was significantly less than the UK’s and the US’s. Figures were retrieved from the Worldometers Covid-19 portal [7]. SA: Saudi Arabia; UK: United Kingdom; US: United States.

