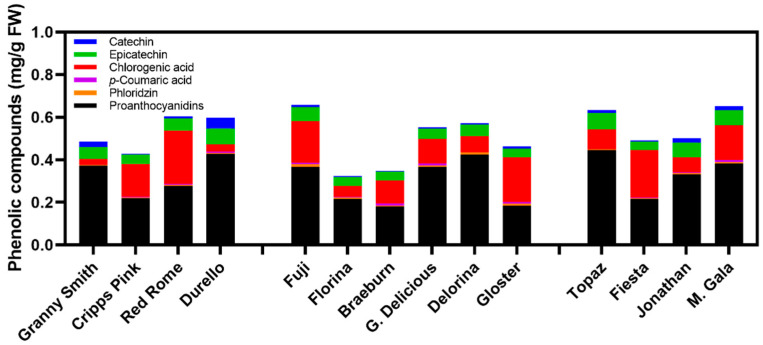
Figure 5.
Composition of the phenolic compounds evaluated via high-performance liquid chromatography (HPLC) organized by each phenolic compound class in each cultivar (averaged from all times). Cultivars are presented in the same order as in Figure 1 based on their level of flesh browning from minimal to severe. Means are displayed for each compound within each cultivar column bar. Statistics available for each compound are available in Table 2.

