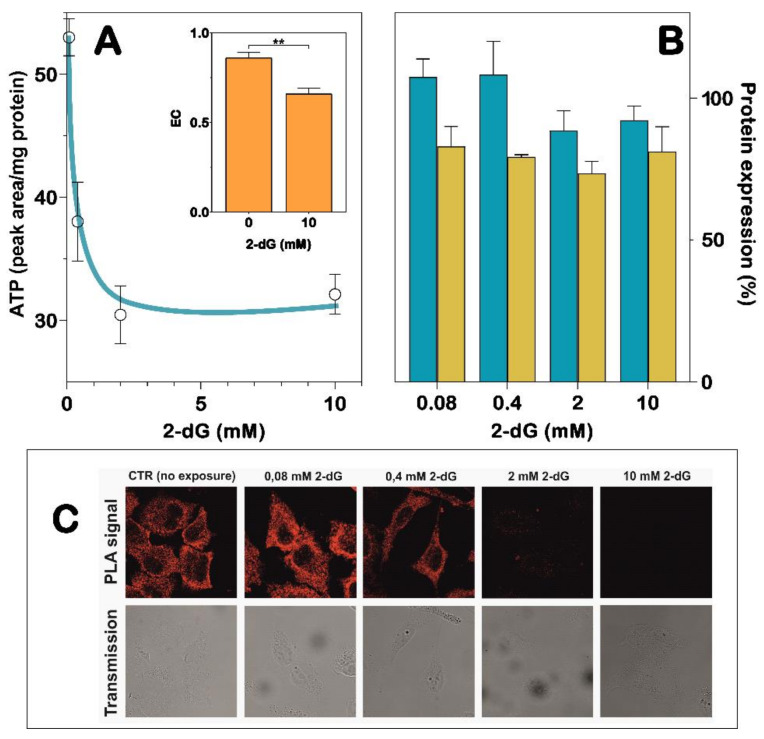
Figure 4.
Effect of oxidative stress conditions on the NT5C2/IPAF interaction. A549 cells were incubated in the presence of increasing concentrations of 2-dG (0.08–10 mM) for 48 h. (A) Cells exposed to 2-dG were submitted to an extraction of nucleotides, and the ATP content was measured by HPLC analysis. The inset shows the adenylate energy charge (EC) values estimated in cells exposed to 0- and 10-mM 2-dG. Results are the mean ± SD of three independent experiments and are expressed as the peak area normalized in the protein content. Statistical significance: ** p < 0.001. (B) ELISA test was performed on A549 cell lysates obtained from cells incubated with 2-dG. The protein content is reported as a percentage of the control: NT5C2 (blue bars) and IPAF (yellow bars). Results are the mean ± SD of three independent experiments. (C) Representative confocal images of the in-situ proximity ligation assay (PLA) in A549 cells. Upper lane: PLA allows the direct visualization and the relative quantification of the NT5C2/IPAF interaction within single cells. The fluorescent red dots indicate the sites of close proximity and the molecular interaction between NT5C2 and IPAF. Lower lane: non-confocal bright field images of the same fields shown in the upper lane.

