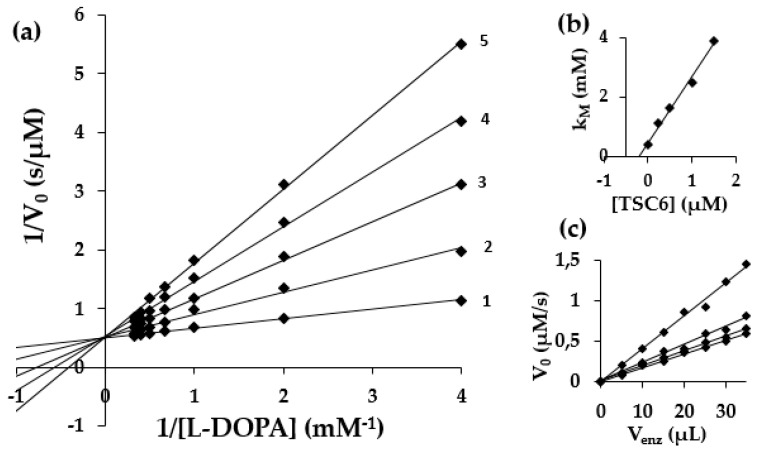
Figure 4.
Lineweaver–Burk plots for inhibition of TSC 6 (a) on mushroom tyrosinase with l-DOPA as substrate. The concentrations of TSC 6 for curves 1–5 were 0.0, 0.1, 0.2, 0.3, and 0.4 µM, respectively. (b) Secondary plot of km versus inhibitor concentrations for determination of Ki for competitive inhibition. (c) Plot to determine the inhibitory mechanism.

